
Volatile
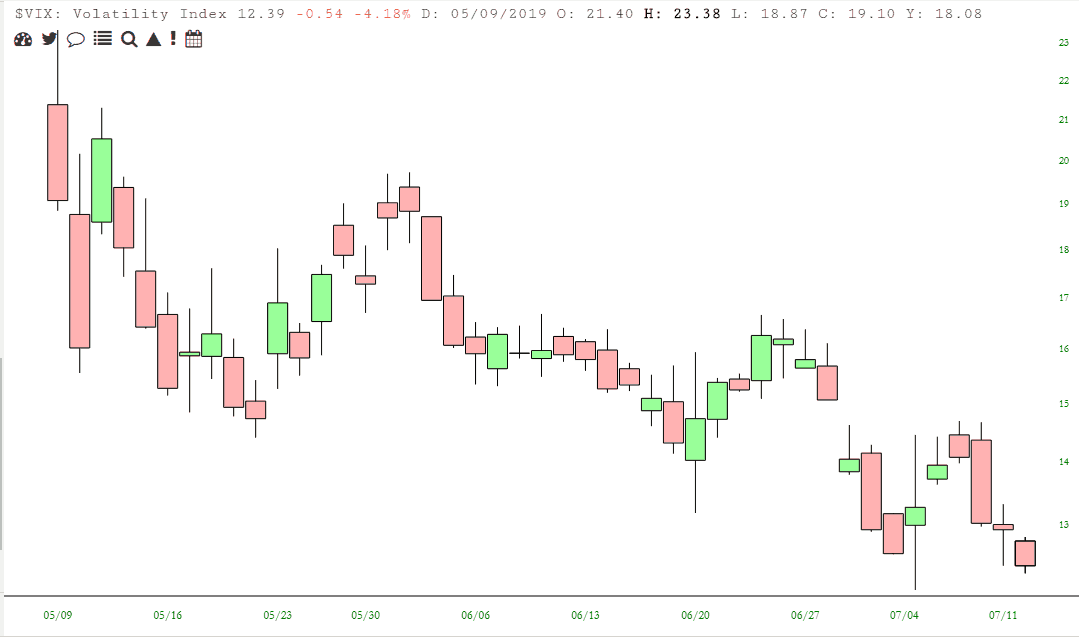
There’s pretty much only one chart which has had the stuffing knocked out of it over the past six weeks: volatility. We are back down into the “nothing bad will ever happen again” pre-teens zone.
I’d like to offer a different view of this, however. Please look at the tinted chart below. In my presentation, the green zones represent complacency, the magenta zones are panic, and the yellow zones are the “tamping down” down by government operatives. We are presently in the green zone (obviously!)
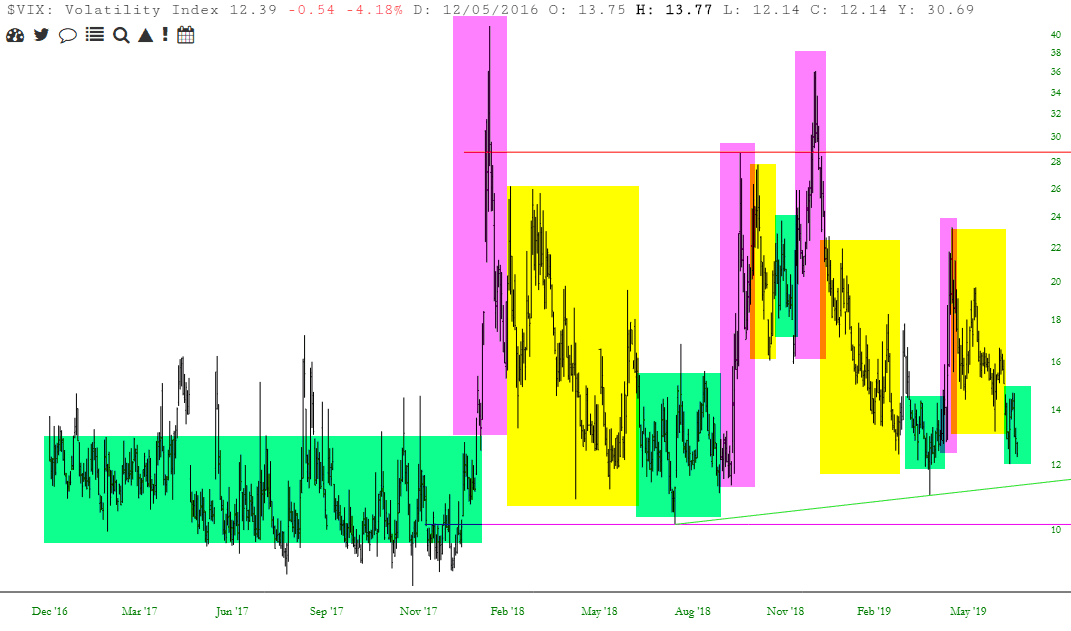
What is interesting is that up until 2018, it was just green, green, green. The bulls were large and in charge. But since this, in spite of the fact that at this very moment we are at the highest levels in human history for equities, the scene for volatility has quite obviously changed.
Here’s a longer view for some perspective.
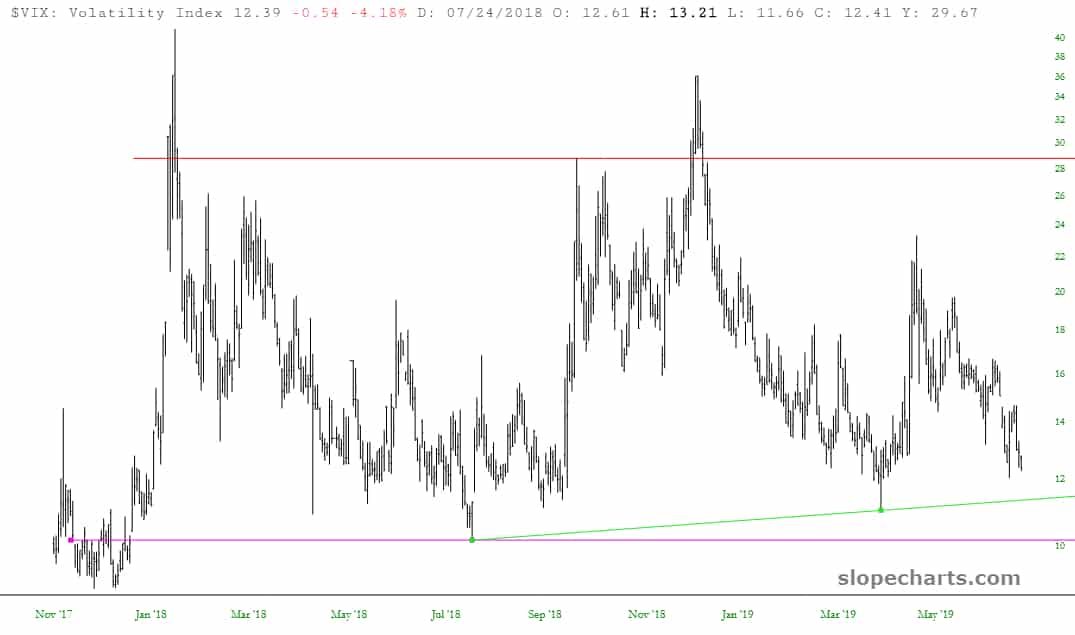
From time to time, out of the blue, volatility goes ripping higher. Who knows the reason for the next one? A good candidate, I’d say, is the forthcoming earnings season.
Disclosure: None.


