
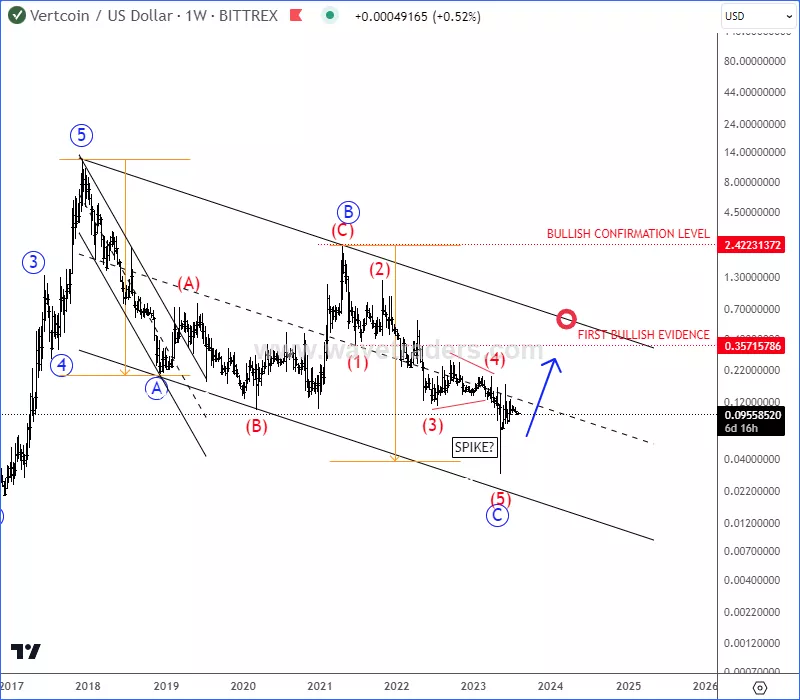
Vertcoin with ticker VTCUSD is one of the oldest ALTcoin that made an impulsive rally back in 2017 bull market. Since 2018 we can see it in a larger, multiyear, higher degree A-B-C corrective movement called zig-zag pattern, which can be finally coming to an end with recent spike down into wave (5) of C. So, if VTCUSD manages to bounce and recover back above 0.35 first bullish evidence level in the second part of 2023, then we can easily expect a bullish continuation.
(Click on image to enlarge)
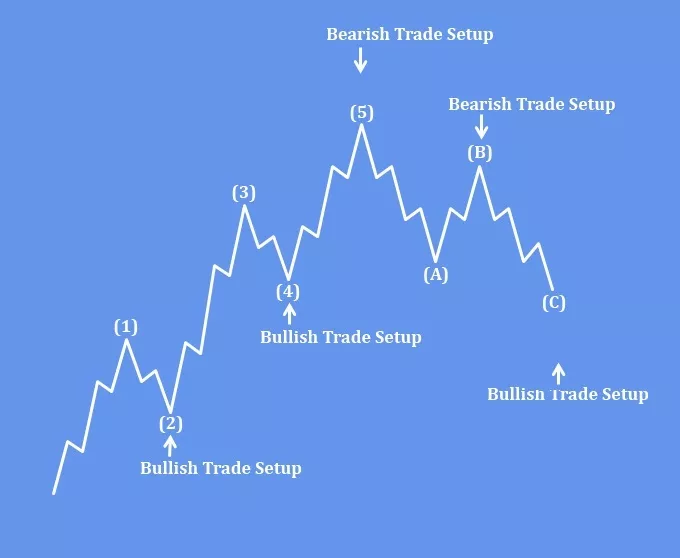
The Elliott Wave Theory is interpreted as follows: Five waves move in the direction of the main trend, followed by three waves in a correction (totaling a 5-3 move). This 5-3 move then becomes two subdivisions of the next higher wave move.
(Click on image to enlarge)
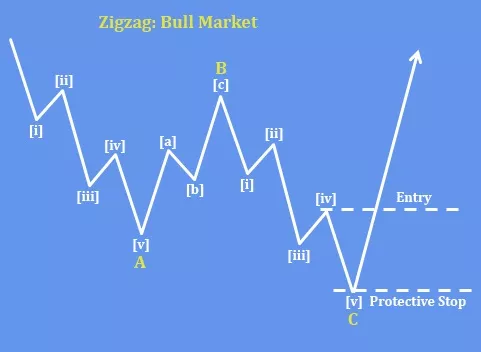
A Zig-Zag is one of Elliott Wave Theory’s corrective pattern, also known as when the market takes a bit of a breather. So, a Zig-Zag consists of a 5 – 3 – 5 sequence and it’s labelled as ABC. A has 5 waves, B has 3 waves and C has 5 waves.
(Click on image to enlarge)
More By This Author:
Japanese Stocks Are Approaching Target Area
PEPE Looks Clearly Bullish
Commodities Are Waking Up From The Support


Comments
Log in or sign up to join the conversation.