
U.S. Tech Sector Blow-Off Top In Progress
Further to my post of February 10 regarding FNGU (an exchange-traded note that tracks 3x the daily price movements on an index of US-listed technology and consumer discretionary companies) and the Nasdaq Composite Index, the following scenario developed.
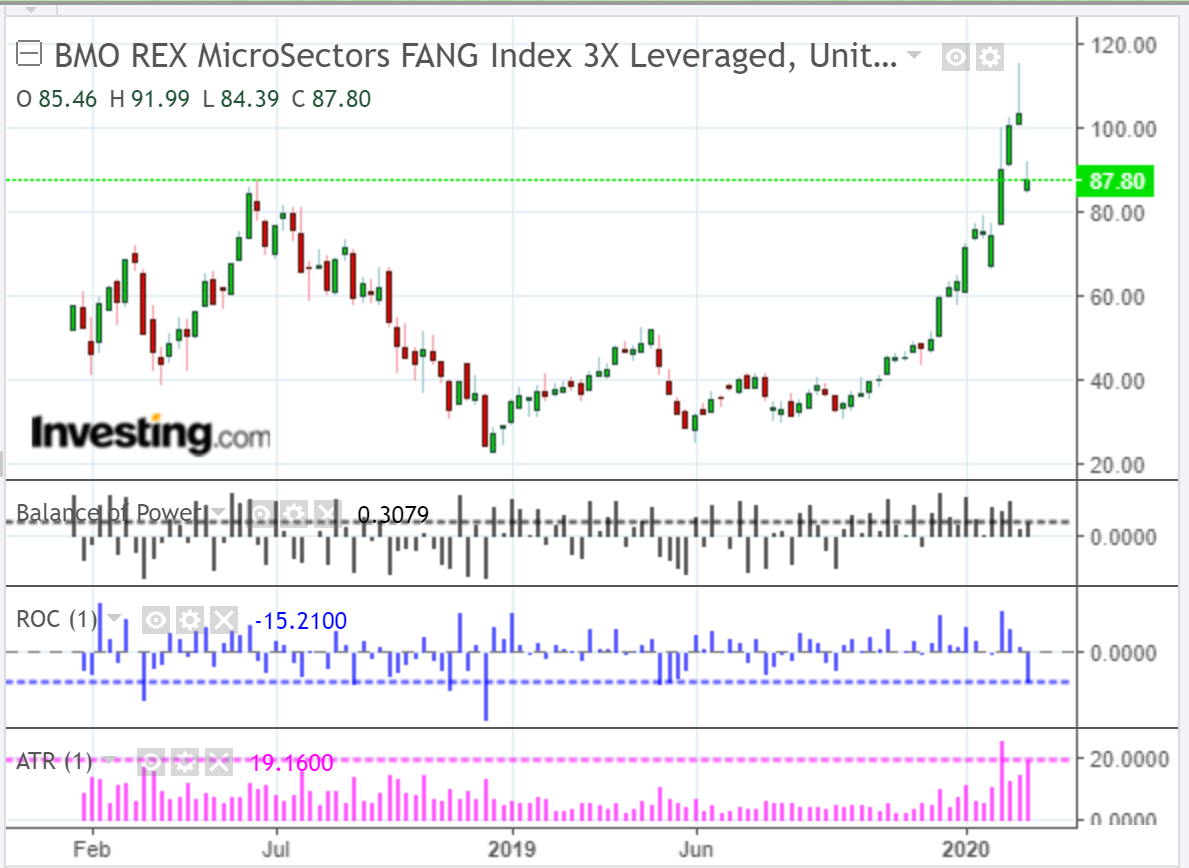
- FNGU did retest its prior all-time high, blew past it, and made a new high at 115.40 last week, as shown on the weekly chart below.
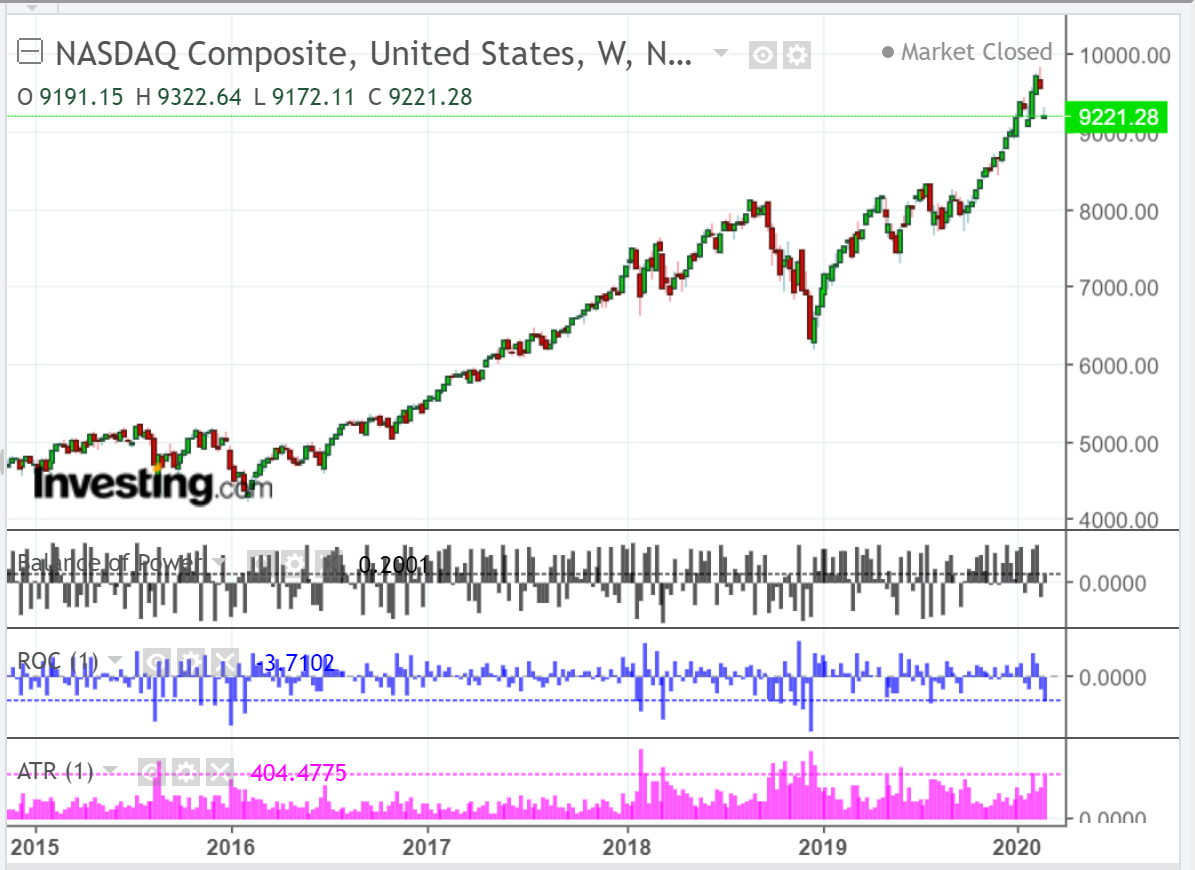
- The Nasdaq Composite Index did attempt to reach 10,000, but stopped short at its new all-time high of 9838.37 last week, as shown on the weekly chart below.
- After they both formed a shooting star candle last week, they gapped down considerably today (Monday) to close near their low of the day.
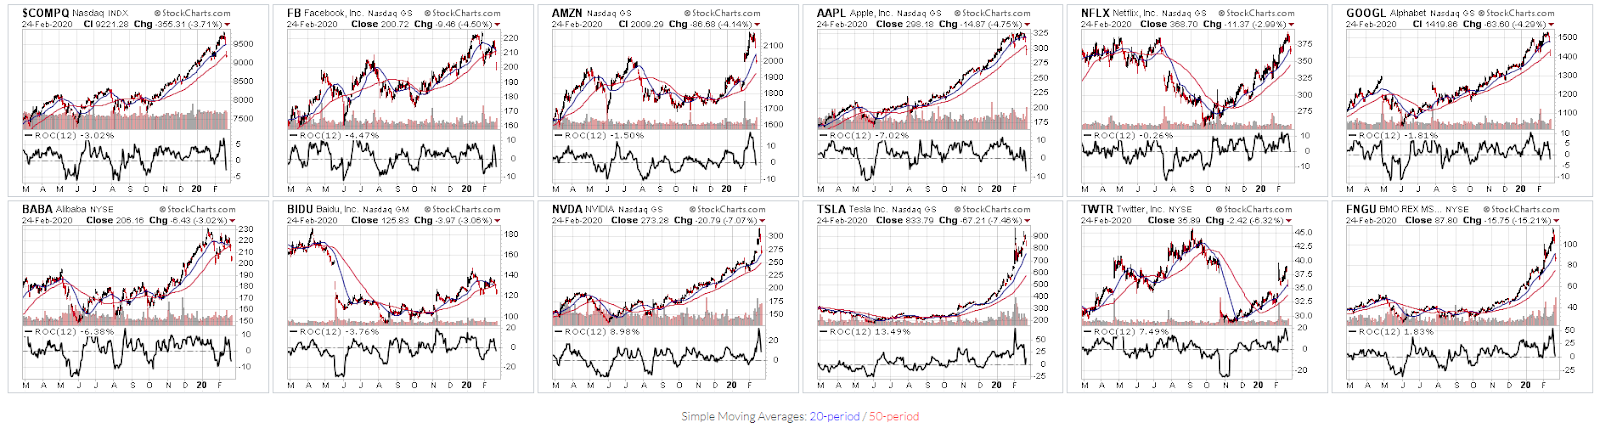
- You can see, from the last two chartgrids (daily timeframe), that all of the ten tech stocks which comprise FNGU gapped and closed down on Monday, as well.
So, where do they all go from here?
- The Balance of Power on FNGU and the Nasdaq Composite Index still lies with the buyers on the weekly timeframe, but that is fading quickly. Watch for a drop and hold below zero to indicate that a larger blow-off is developing. Otherwise, if it holds above zero, look for some short-term buying or short-covering or a dead cat bounce before further selling, potentially, resumes.
- Keep an eye on the ROC (Rate of Change) and ATR (Average True Range) to confirm, either further selling, or a sharp turnaround in buying. I've shown the input value on both of these technical indicators as one period and in histogram format to highlight extreme movements in either direction. Neither one has matched prior all-time extremes yet, so we may see further selling before any serious longer-term buyers step into the Technology sector.
- You can see from the last two chartgrids where Monday's closing price on each of the ten stocks, as well as FNGU and the Nasdaq Composite Index, sits in relation to their respective 50-day moving average (red). They are either above, below or near it, which is acting as support or resistance. Three of them (FB, BABA and BIDU) are the weakest, after failing to make new swing highs, and their 20-day MA is in the process of crossing below their 50-day MA...hinting at further weakness ahead for these three stocks. The ROC on 8 out of the 12 are below the zero level...hinting at further weakness ahead for the Tech sector. Keep an eye on the ROC on NVDA, TSLA, TWTR and FNGU on the daily timeframe...if they also drop and hold below zero, and if the others hold below, watch for further sharp selling in the Tech sector.
- Finally, keep an eye on the 4 E-mini Futures Indices and the SPX:VIX ratio mentioned in my last post. If we see further weakness develop in those, we'll likely see continued selling in the above-referenced stocks, ETF and Index.
(Click on image to enlarge)
(Click on image to enlarge)
(Click on image to enlarge)
(Click on image to enlarge)
How did you like this article? Let us know so we can better customize your reading experience.

Comments
Leave a comment to automatically be entered into
our contest to win a free Echo Show.

