
Wobbly Economic Outlook Favored Bonds Last Week
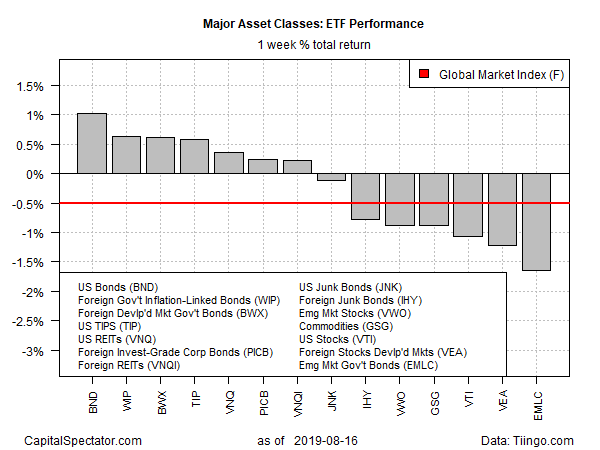
Rising worries about the global economy triggered a strong wave of fixed-income buying last week, propelling US bonds to the top of the performance ledger for the major asset classes, based on a set of exchange-traded funds.
Vanguard Total Bond Market (BND) surged 1.0% last week. The gain for the trading week ended Aug. 16 marked the ETF’s biggest weekly advance in a decade.
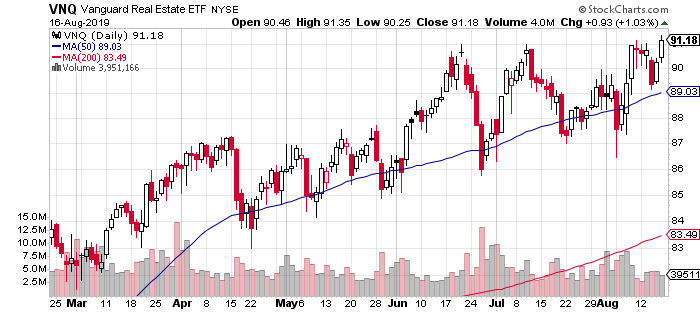
Foreign investment-grade bond funds delivered solid advances last week as well. Real estate investment trusts (REITs) were also swept up in the buying, presumably due to asset class’s relatively high yields, which are becoming increasingly prized as global interest rates continue to trend lower, in some cases into negative terrain. Vanguard Real Estate (VNQ) rallied to close at a record high, based on the fund’s history after factoring in distributions.
Not all corners of the debt world were on the crowd’s shortlist for buying last week. Notably, junk bonds lost ground.
Last week’s biggest loser: bonds issued by emerging market governments. VanEck Vectors JP Morgan EM Local Currency Bond (EMLC) slumped 1.6% The fund has fallen in three of the past four weeks and ended last week near a two-month low.
The upside bias in investment-grade bonds wasn’t enough to offset the losses elsewhere for an ETF-based version of the Global Market Index (GMI.F). This unmanaged benchmark, which holds all the major asset classes (except cash) in market-value weights, slumped 0.5%–GMI.F’s third straight weekly decline.
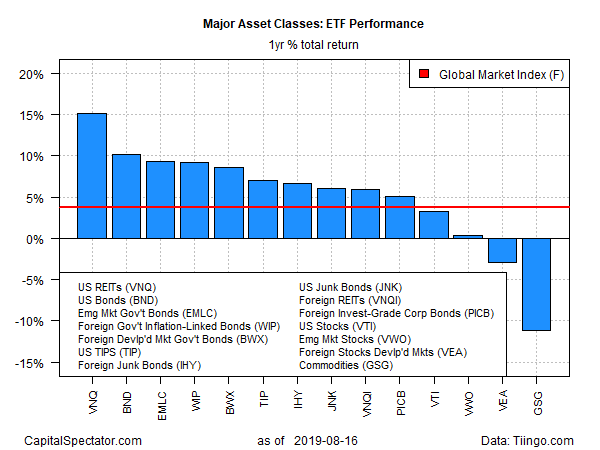
For one-year results, US REITs are still firmly in the lead. Vanguard Real Estate (VNQ) is up 15.2% over the past 252 trading days after factoring in distributions.
Meantime, broadly defined commodities continue to post the biggest one-year loss for the major asset classes: GSG is down 11.1% over the past year.
GMI.F’s one-year change is a modest 3.7% gain.
Despite the latest correction, most of the major asset classes remain in positive terrain in terms of momentum, based on two sets of moving averages for the ETFs listed above. The first compares the 10-day moving average with its 100-day counterpart — a proxy for short-term trending behavior (red line in chart below). A second set of moving averages (50 and 200 days) represent an intermediate measure of the trend (blue line). As of Friday’s close, the short-term indicator continued to lose ground, although it remains above the 50% mark. The intermediate indicator is higher, reflecting (still) a strong degree of bullish momentum. For now, the crowd seems reluctant to fully price in high odds that a recession (either in the US or for the global economy) is destiny in the near term.

Disclosure: None.

Comments
 No Thumbs up yet!

