
With Price Surge, Analysts Hope For Higher Oil Prices In 2018
One of the hallmarks of the past few years has been relatively low energy prices. The US benefits from massive production of oil and gas due to fracking technology and new sources of energy. However, that may be coming to an end where oil is concerned.
Analysts note that prices have surged recently. Today, we saw futures rising to @62/barrel in the US and Brent crude oil futures went up more and are now running @ $69/barrel. Analysts believe that development across the globe will drive prices higher as more people reach for--and achieve a middle-class lifestyle and thus demand for energy increases as well. In fact, some analysts are now predicting oil prices in the range of $80/barrel for 2018.
Of course, higher crude has been promised for years now, and we have not seen anything like the prices which existed prior to the Bush recession and subsequent economic crisis. Low energy prices are one of the reasons we have had issues with deflation during the ensuing decad despite the cries for higher interest rates from central banks.
Below, we present the latest data on Oil/Energy stocks from our Professional Stock Analysis Service. Top- five lists are provided for each category. We applied some basic liquidity criteria -- share price greater than $3 and average daily volume in excess of 100k shares.
Top-Five Oil/Energy Stocks--Short-Term Forecast Returns
|
Ticker |
Name |
Mkt Price |
Valuation (%) |
Last 12-M Return (%) |
|
BAK |
BRASKEM SA |
28.1 |
85.56% |
28.25% |
|
SDLP |
SEADRILL PTNRS |
3.95 |
-31.74% |
N/A |
|
PBFX |
PBF LOGISTICS |
21.45 |
1.80% |
6.45% |
|
ORIG |
OCEAN RIG UDW |
27.96 |
N/A |
-99.85% |
|
UPL |
ULTRA PETRO COR |
8.54 |
-63.20% |
N/A |
Top-Five Oil/Energy Stocks--Momentum
|
Ticker |
Name |
Mkt Price |
Valuation (%) |
Last 12-M Return (%) |
|
IO |
ION GEOPHYSICAL |
22.3 |
N/A |
294.69% |
|
TGS |
TRANSPORTADORA |
22.21 |
N/A |
132.32% |
|
EC |
ECOPETROL- ADR |
16.87 |
N/A |
81.40% |
|
ALDW |
ALON USA PTNRS |
18.1 |
N/A |
79.74% |
|
CVI |
CVR ENERGY INC |
39.29 |
N/A |
77.62% |
Top-Five Oil/Energy Stocks--Composite Score
|
Ticker |
Name |
Mkt Price |
Valuation (%) |
Last 12-M Return (%) |
|
ANDV |
ANDEAVOR CORP |
115.99 |
-2.26% |
42.01% |
|
SEP |
SPECTRA EGY PTR |
41.74 |
-16.36% |
-11.36% |
|
BAK |
BRASKEM SA |
28.1 |
85.56% |
28.25% |
|
ERF |
ENERPLUS CORP |
10 |
-30.29% |
12.61% |
|
BWP |
BOARDWALK PIPLN |
12.97 |
-44.53% |
-29.20% |
Top-Five Oil/Energy Stocks--Most Overvalued
|
Ticker |
Name |
Mkt Price |
Valuation (%) |
Last 12-M Return (%) |
|
ESV |
ENSCO PLC |
7.08 |
300.00% |
-39.49% |
|
BAS |
BASIC EGY SVCS |
26.28 |
300.00% |
-28.02% |
|
HOS |
HORNBECK OFFSHR |
3.85 |
275.89% |
N/A |
|
DO |
DIAMOND OFFSHOR |
19.84 |
131.57% |
3.44% |
|
KEG |
KEY ENERGY SVCS |
15.38 |
115.92% |
-57.17% |
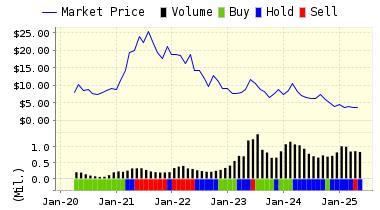
For today's bulletin, we take a look at our leader in the oil industry in terms of short-term forecast return, Braskem SA (BAK). Braskem is the largest petrochemical operation in Latin America and among the five largest private companies in Brazil. With industrial facilities located in Alagoas, Bahia, Sao Paulo and Rio Grande do Sul, Braskem produces primary base petrochemicals such as ethylene, propylene, benzene, caprolactam, DMT and termoplastic resins (polypropylene, polyethylene, PVC and PET) gas and GLP.
ValuEngine continues its STRONG BUY recommendation on Braskem SA for 2018-01-09. Based on the information we have gathered and our resulting research, we feel that Braskem SA has the probability to OUTPERFORM average market performance for the next year. The company exhibits ATTRACTIVE P/E Ratio and Company Size.
|
ValuEngine Forecast |
||
|
Target |
Expected |
|
|---|---|---|
|
1-Month |
28.57 | 1.21% |
|
3-Month |
29.35 | 3.98% |
|
6-Month |
30.45 | 7.85% |
|
1-Year |
32.35 | 14.60% |
|
2-Year |
40.33 | 42.87% |
|
3-Year |
45.51 | 61.21% |
|
Valuation & Rankings |
|||
|
Valuation |
86.42% overvalued |
Valuation Rank |
|
|
1-M Forecast Return |
1.21% |
1-M Forecast Return Rank |
|
|
12-M Return |
28.85% |
Momentum Rank |
|
|
Sharpe Ratio |
0.31 |
Sharpe Ratio Rank |
|
|
5-Y Avg Annual Return |
13.53% |
5-Y Avg Annual Rtn Rank |
|
|
Volatility |
43.58% |
Volatility Rank |
|
|
Expected EPS Growth |
-40.09% |
EPS Growth Rank |
|
|
Market Cap (billions) |
11.25 |
Size Rank |
|
|
Trailing P/E Ratio |
6.43 |
Trailing P/E Rank |
|
|
Forward P/E Ratio |
10.73 |
Forward P/E Ratio Rank |
|
|
PEG Ratio |
n/a |
PEG Ratio Rank |
|
|
Price/Sales |
0.75 |
Price/Sales Rank |
|
|
Market/Book |
8.36 |
Market/Book Rank |
|
|
Beta |
1.13 |
Beta Rank |
|
|
Alpha |
0.01 |
Alpha Rank |
|
Disclosure: None.


