
Winning And Losing Streaks In The DJIA In The Age Of Trump
We're tied up with other projects today, but for some quick fun, we threw together the following chart showing the trajectory of the Dow Jones Industrial Average (DJIA) since 8 November 2016 (a.k.a. "The Age of Trump"), where we've noted some unusual winning and losing streaks in just the past two months....
(Click on image to enlarge)
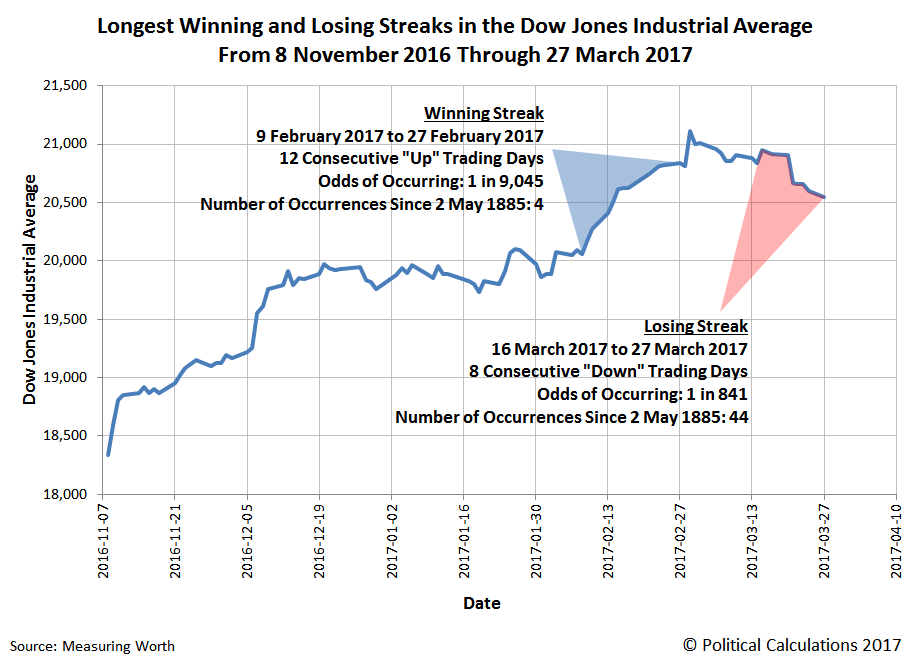
Going back to 2 May 1885, there have been a total of 4 winning streaks where the DJIA closed higher than its previous day's close over 12 consecutive trading days, with the fourth just having ended on 27 February 2017.
By contrast, there have been 43 losing streaks where the DJIA closed lower than its previous day's closing value on 43 separate occasions since 2 May 1885, where the current losing streak through yesterday, 27 March 2017 may not yet be over.
Should the current losing streak extend a ninth day, it will mark just the twelfth time in the last 132 years where the Dow has dipped for that many days in a row.
Disclosure: None.


