
Will SPX Test Its September High?
(Click on image to enlarge)
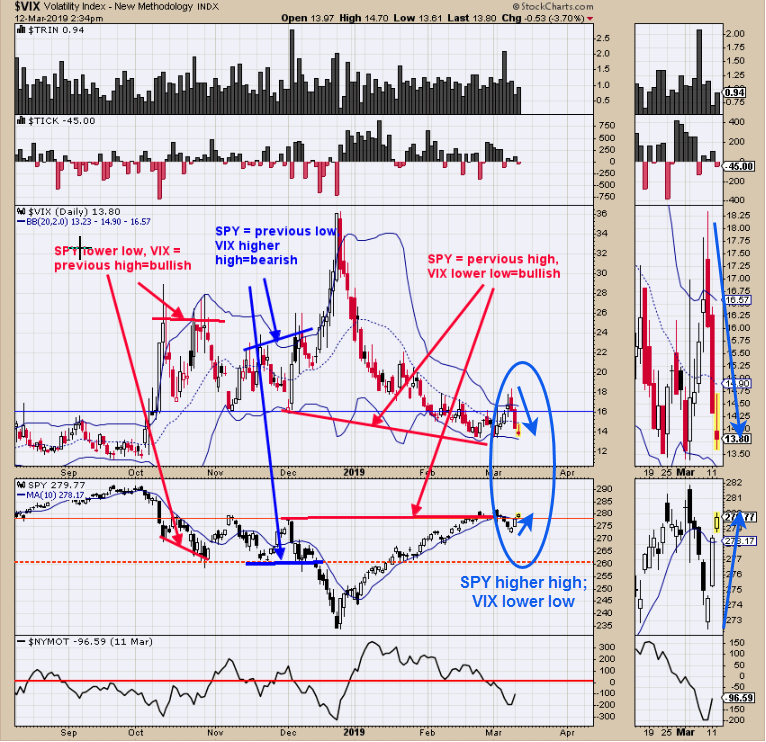
The VIX trades opposite the SPY. It is common for the VIX to lead (in the opposite direction) the SPY. So far divergences between SPY and VIX have not shown up, suggesting the current trend should continue which is up for the SPY. In the far right corner there is a micro window for the SPY and VIX; just “eyeballing” the price movement, it appears VIX is closer to the previous lows as SPY is to its previous high, showing VIX is outperforming to the down which is a bullish sign for the SPY. If VIX manages to hit a new short term low in the next couple of days, to keep on track, it will imply the SPY will hit a new short term high. Also, VIX remains below +16 which is bullish intermediate term.
(Click on image to enlarge)
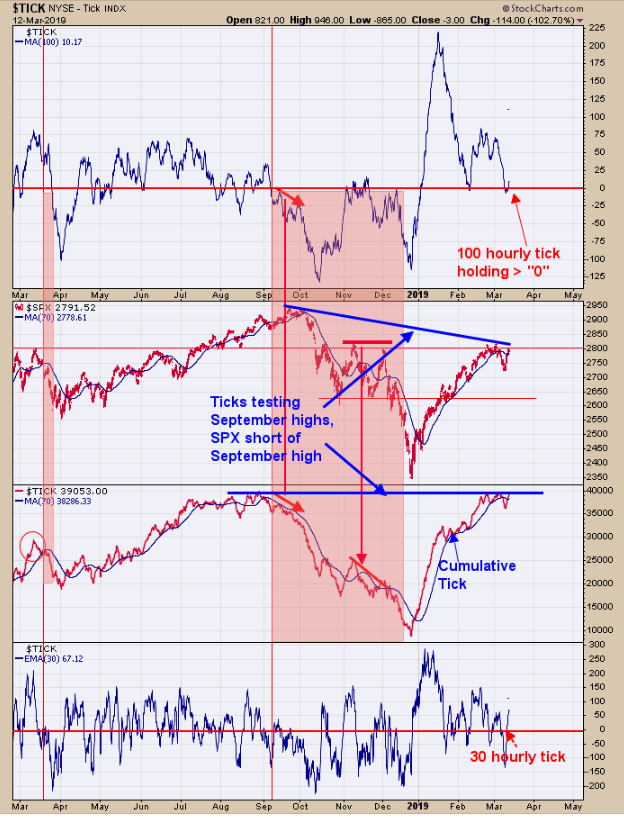
The top window is the 100 hour moving average of the tick. In up-trends, the 100 hourly tick stays above “0” and the current reading is +10.17. The 100 hourly tick gained ground from yesterday and a bullish sign for SPX. The bottom window is the 50 hourly moving average of the tick. Since it moves faster than the 100 hourly tick the chart is not as neat. It works the same way as the 100 hourly tick but moves above and below “0” more frequently; right now it's above “0” and bullish. Yesterday we pointed out that it’s common for the tick to lead the SPX. The Cumulative tick (middle window) is testing its September high and suggests at some point the SPX will test its September high; the question is when. There is a possibility the current rally could continue to the September highs, but we will have to see what happens at the early March highs. Long SPX on 3/8/19 at 2743.07.
(Click on image to enlarge)
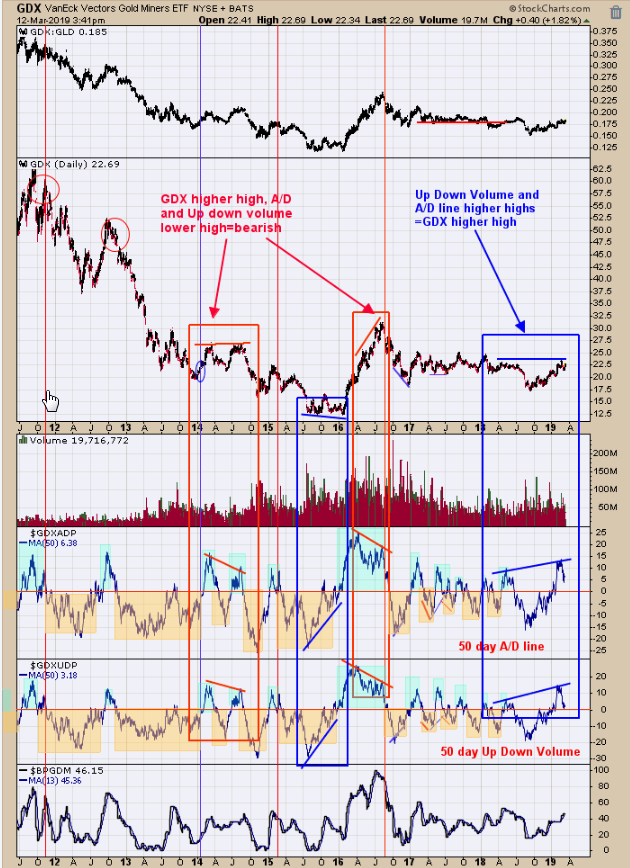
The second window up from the bottom is the 50 period moving average of the Up-Down Volume. Readings above “0” are a bullish sign for GDX. Also bullish is that Up-Down Volume has made higher highs and a bullish divergence for GDX showing market getting stronger. Next window up is the 50 day moving average of the Advance/Decline. Readings above “0” are also bullish sign for GDX. This indicator also has made higher highs showing the market is getting stronger. Also long as both Up Down volume and Advance/Decline indicators remain above “0” the uptrend should continue. Long GDX on 1/29/19 at 21.97.
Disclaimer: Signals are provided as general information only and are not investment recommendations. You are responsible for your own investment decisions. Past performance does not guarantee future ...
more


Good stuff, thanks.