

Image Source: Pexels
The S&P opened up 120 points this morning.
Nvidia (NVDA) crushed earnings. The delayed September jobs report came in at 119,000. Every technical indicator screamed bullish. The advance-decline ratio hit 21 to 4.
I watched my account go vertical as shorts covered and call buyers rushed in.
Then I checked the money flow indicator. Institutional money was pouring out of the market while retail bought every dip.
That divergence told me everything I needed to know. Institutions used Nvidia's earnings beat as cover to reduce their exposure. The pop lasted less than an hour before the market gave back half the gains.
Charts show you what happened. Money flow shows you what institutions are actually doing with their capital. When those two disconnect completely, you're staring at a trap.
Every major distribution event starts with price making new highs while money flow deteriorates. The candles look bullish. The momentum feels unstoppable. But the smart money is walking out the back door while retail rushes through the front.
Spotting this divergence in real time separates professionals who preserve capital from traders who buy tops.
Today, I'm showing you how to identify institutional distribution before it destroys your positions.
When Superman Shows Up But Money Walks Out
Nvidia saved the market today. That's not hyperbole.
We were sitting on critical support at 6,575. The market bit at that level multiple times without breaking through. Then along comes Nvidia with earnings that exceeded expectations and guidance that sent the stock to $200 in aftermarket trading.
The timing was almost manufactured. The market needed a savior to prevent a breakdown. Nvidia delivered exactly when required. Add the delayed September jobs report showing 119,000 new jobs and you had a double shot of bullish catalyst driving prices higher.
The S&P gapped up 120 points at the open. Call buyers went vertical. Shorts panicked. The advance-decline ratio hit 21 to 4. Every surface indicator pointed to sustained strength.
But here's what the candles didn't show you. Institutions were using that exact pop to unload positions.
What Real Buying Pressure Actually Looks Like
Before analyzing today's divergence, you need to understand what healthy accumulation looks like when institutions actually want to own something.
Walmart (WMT) sat at $100 for three weeks two weeks ago. The stock held that support level repeatedly without breaking down. The chart looked boring. Momentum traders avoided it completely.
(Click on image to enlarge)
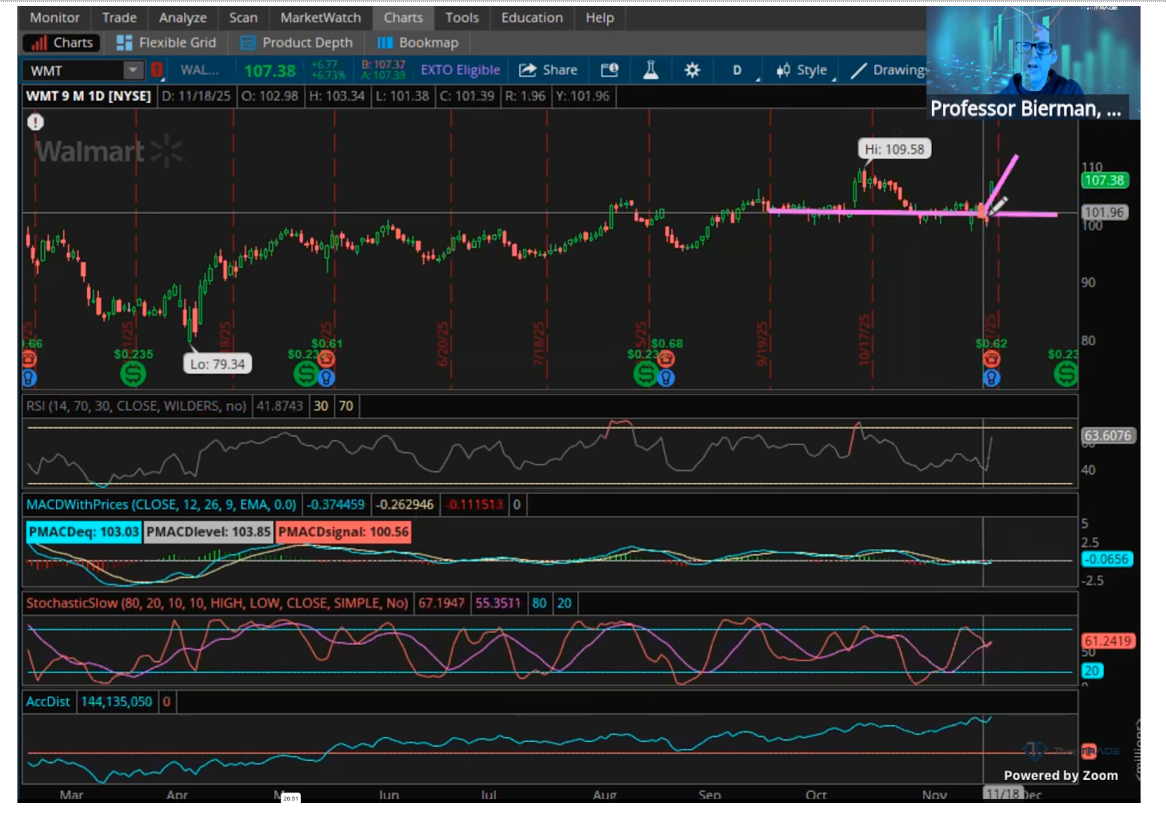
Then Walmart reported earnings. Beat by two cents and guided higher for next year. The stock gapped up and institutions immediately bought the breakout.
Look at the money flow indicator during that rally. The accumulation/distribution line went parabolic to the upside. Institutional money poured into the stock as price climbed. Volume expanded on every up day.
That's what real buying pressure looks like. Money flow and price action moving in the same direction. Institutions positioning for sustained strength. The rally validated by smart money accumulation.
Now compare that pattern to what happened this morning.
The Five-Minute Indicator That Revealed Distribution
The market opened up 120 points. That's the gap and go pattern everyone recognizes. Price action looked explosive. Momentum appeared unstoppable.
(Click on image to enlarge)
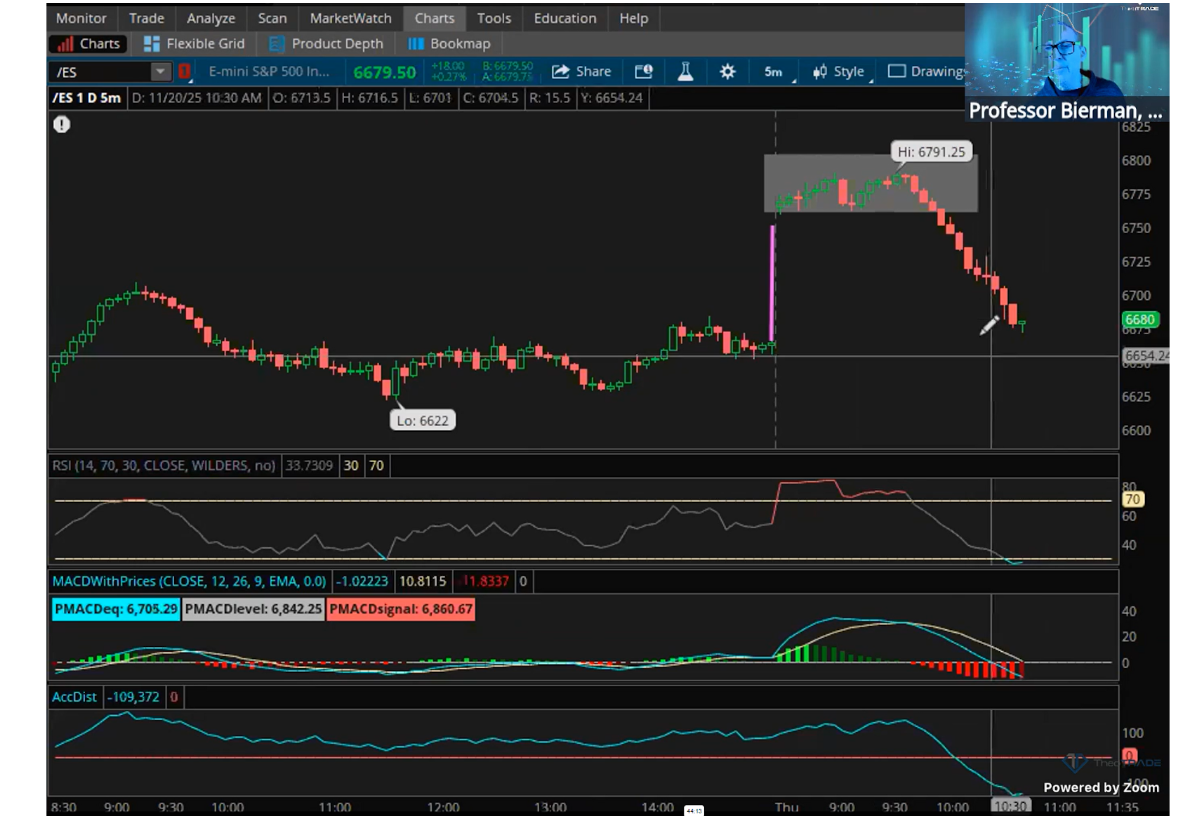
The money flow indicator told a completely different story. While price climbed, the accumulation/distribution line went parabolic to the downside. This wasn't short covering driving the rally. This was institutional selling into retail buying.
The five-minute indicator is my favorite timeframe because it shows you exactly when smart money changes direction. When that indicator goes waterfall negative while price is making highs, you're watching distribution in real time.
Institutions used the Nvidia pop to cut back their risk. They saw the advance-decline at 21 to 4 and recognized the perfect exit opportunity. Retail traders were buying into strength. Professionals were selling to them.
Within an hour, the market had given back half the gains.
The Flag Formation That Confirmed the Trap
After the morning gap, the market created a textbook bearish flag formation. Price moved sideways for thirty minutes creating parallel boundaries between the highs and the pullback lows.
[CHART: Intraday S&P showing bearish flag formation with distribution during consolidation]
The flagpole was the morning gap up. The flag was the consolidation that followed. Most traders looked at that pattern and assumed the breakout would continue higher. They saw it as a bullish continuation setup.
The money flow indicator revealed what was actually happening. Money continued leaving during that consolidation. The flag wasn't building energy for another leg up. It was institutions methodically distributing positions to retail buyers who chased the Nvidia headlines.
When the flag broke to the downside, the systematic selling accelerated. The market gave back 100 points in two hours. Anyone who bought the morning strength was underwater by lunch.
This is why I never buy gap ups. The opening action creates the worst possible risk-reward setup. You're buying after the move already happened. You're entering when institutions are positioned to exit. You have no idea whether money flow validates the price action.
How to Apply This Knowledge
The distinction between Walmart's rally and today's action comes down to one indicator. Money flow.
Walmart's accumulation/distribution line climbed with price. Institutions were positioning for sustained strength. Today's line collapsed while the S&P made new highs. Institutions were using strength to exit.
Add the accumulation/distribution indicator to your platform. Watch what it does relative to price. When both move together in the same direction, you're seeing real institutional positioning. When they diverge, you're seeing distribution disguised as strength.
I've lost millions over 25 years by skipping this money flow check. Every time I ignored that indicator and traded based on candles alone, my account got destroyed. Every single time.
Today provided the clearest example I've seen in months. Nvidia earnings created perfect cover for institutional selling. The headlines gave retail traders confidence to buy. Smart money used that exact liquidity to reduce exposure.
Track the money and you will rarely go wrong. Buy what institutions are accumulating. Avoid what they're distributing. The candles will lie to you repeatedly. Money flow never does.
More By This Author:
Could This Be The Perfect Volatility Play?Did You Play Nvidia Earnings Correctly?
Did NVDA Help The Market Find it's Mojo?


Comments
Log in or sign up to join the conversation.