Image Source: Unsplash
Many years ago, when we were researching silver mining companies, I was fascinated to learn how insensitive production and consumption were to prices. Unlike gold, which is mostly held as an investment, silver has many industrial uses. Consumer electronics represents over a third of demand. Silver has few good substitutes and is a comparatively small part of the total cost of the products it supports. So manufacturers just pay what they must.
Most silver is produced as a byproduct of either lead, zinc, or gold. As such, the price of silver isn’t a major influence on output. The result is that silver volumes aren’t that sensitive to price, which is why its price volatility is generally higher than for other precious metals such as gold.
There’s an interesting analogy with oil and gas in the US. Price forecasts for crude are bearish. The Energy Information Administration (EIA) expects Brent to average $51 a barrel next year. Goldman Sachs sees oil in the low 50s by H2'26. Brent is currently around $67.
The EIA sees only a modest impact on production, with US output falling from 13.4 Million Barrels per Day (MMB/D) this year to 13.3 MMB/D in 2026. As we noted in last week’s blog post, the EIA’s forecast production drop looks optimistic.
Upstream companies are preparing for something more dramatic. ConocoPhillips says it may lay off up to a quarter of its workforce by the end of the year. Chevron expects to cut by 15%-20%. Perhaps the analysts at the EIA are wary of publishing forecasts that will antagonize the White House.
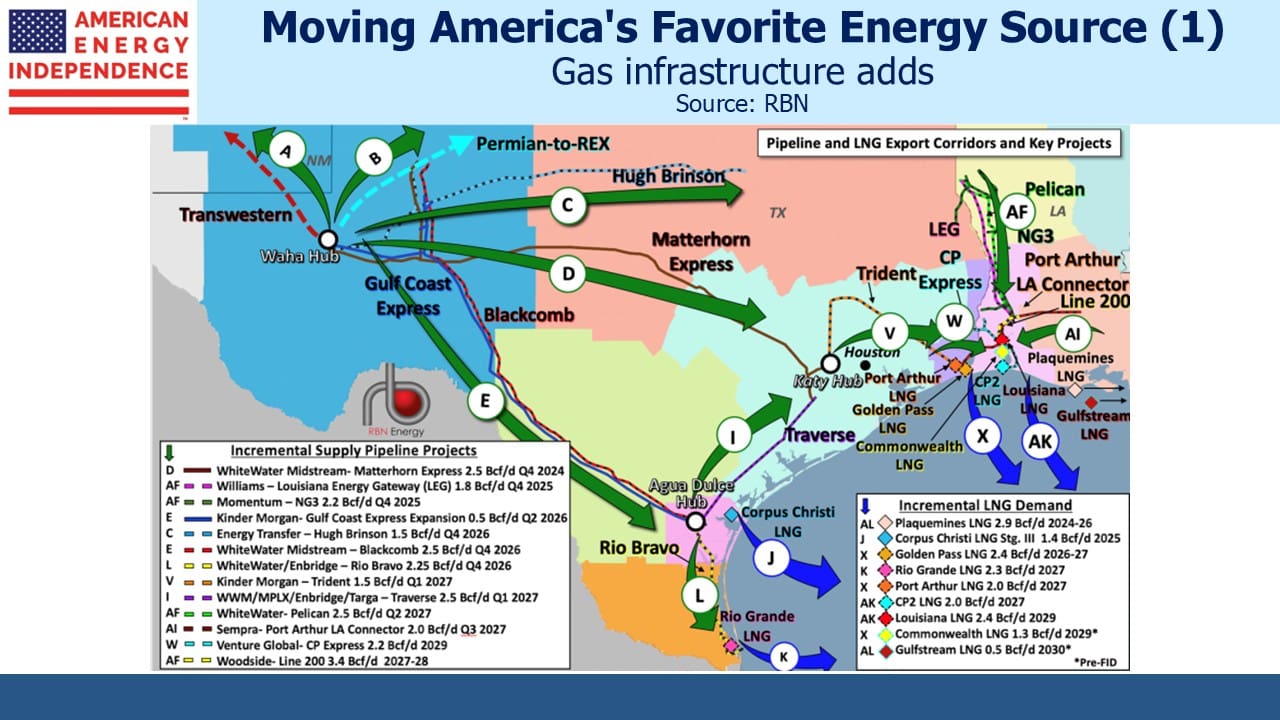
Oil wells in the Permian basin in west Texas and New Mexico produce associated gas, which means the oil/gas combination that comes out of the ground has to be separated. The oil is what they want. The region has been chronically short of gas infrastructure for years, although demand from data centers and LNG export terminals has recently spurred several new pipeline projects.

(Click on image to enlarge)
This raises an interesting problem. If crude output drops farther than the EIA expects, natural gas output from the Permian will fall, too. This will occur just as demand from data centers and LNG export terminals is ramping up. It’s why the EIA expects the Henry Hub natural gas benchmark to reach $5 per Million BTUs (MMBTUs) next year, compared to $3 currently.
In a quirk of the relationship between the two commodities, softness in crude oil could drive natural gas prices higher if E&P companies respond by cutting oil output, since in the Permian this would lower gas output, too.
Just as silver production can be driven by the price of gold where they’re mined together, gas output in the Permian can depend on the price of oil.

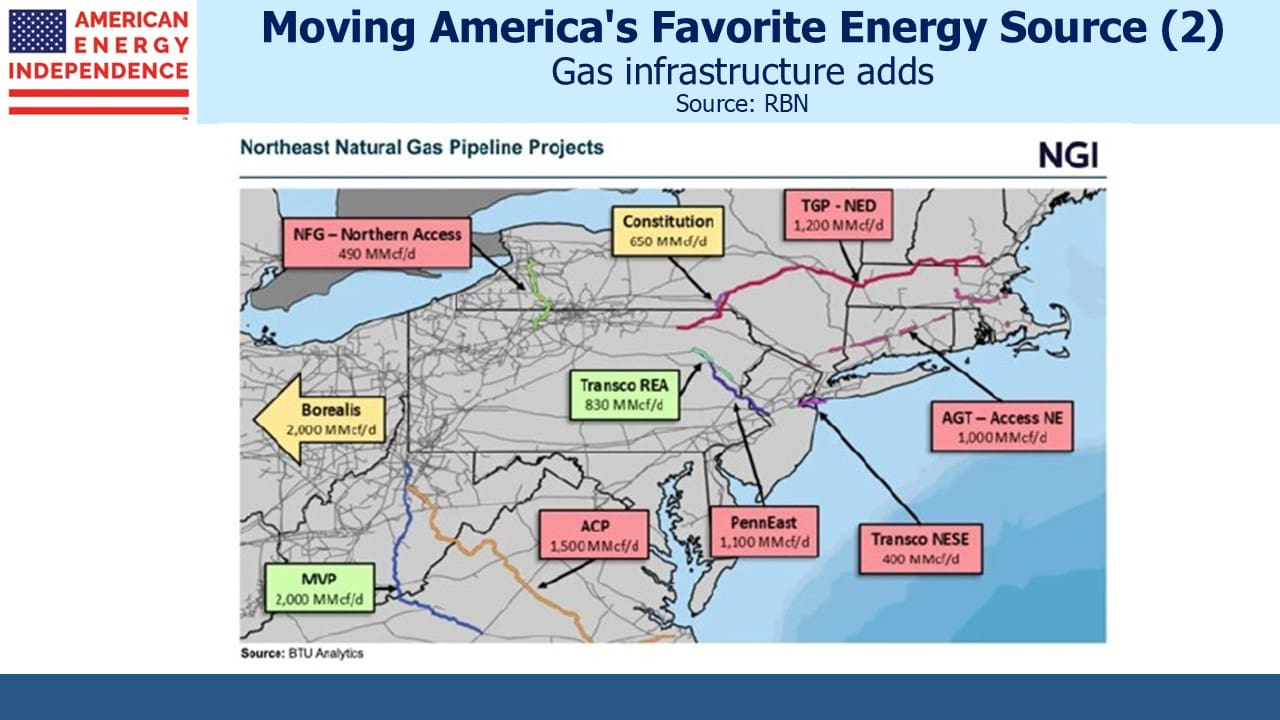
(Click on image to enlarge)
This will create an opportunity for drillers in the Marcellus and Utica shales in Appalachia which is rich in gas and natural gas liquids, therefore responsive to gas prices.
Some have warned of a glut of US LNG supply, but importing countries are building regassification terminals, too. The capacity of importers is on pace to be roughly 2X the world’s liquefaction capacity. So if every import terminal operated half the time, 100% of the world’s LNG export terminals would be in use.
EQT, a gas producer, just signed a deal with NextDecade. Normally it’s the buyers of LNG who contract for liquefaction capacity, but in this case a producer wants to lock in the ability to send their US-sourced natural gas overseas.
Weak oil prices have hurt sentiment across the energy sector. Even though midstream infrastructure has limited sensitivity to commodity prices, this has probably given some potential buyers pause before committing capital. The positive natural gas outlook hasn’t provided a sufficient counterweight, perhaps because regional gas prices vary widely since transportation costs can exceed the Henry Hub benchmark.
By contrast, moving oil costs a small fraction of the price of a barrel. There’s a global crude price that commands attention while movements in regional gas prices don’t resonate as much.
US natural gas prices are low by global standards. Even at $5 per MMBTUs the spread to European and Asian LNG benchmarks will sustain the economics of gas exports to those regions.
As for data centers, the other source of demand growth, they’re most concerned with reliable power and how quickly it can be delivered. The newest data centers are seeking uptime of all but three seconds a year (i.e. to run 99.99999% of the time). Solar and wind, with their 20%-35% capacity utilization, are hopeless in this respect.
Oil and gas prices in the US look set to diverge.
We have two have funds that seek to profit from this environment:
- Pacer American Energy Independence ETF (USAI)
- Catalyst Energy Infrastructure Fund (MLXAX)
More By This Author:
Midstream Is Better Under Trump 2.0Not All Growth Projects Are GoodStrengthening Your Portfolio With Pipelines
Disclosure: The information provided is for informational purposes only and investors should determine for themselves whether a particular service, security or product is suitable for their ...
more
Disclosure: The information provided is for informational purposes only and investors should determine for themselves whether a particular service, security or product is suitable for their investment needs. The information contained herein is not complete, may not be current, is subject to change, and is subject to, and qualified in its entirety by, the more complete disclosures, risk factors and other terms that are contained in the disclosure, prospectus, and offering. Certain information herein has been obtained from third party sources and, although believed to be reliable, has not been independently verified and its accuracy or completeness cannot be guaranteed. No representation is made with respect to the accuracy, completeness or timeliness of this information. Nothing provided on this site constitutes tax advice. Individuals should seek the advice of their own tax advisor for specific information regarding tax consequences of investments. Investments in securities entail risk and are not suitable for all investors. This site is not a recommendation nor an offer to sell (or solicitation of an offer to buy) securities in the United States or in any other jurisdiction.
References to indexes and benchmarks are hypothetical illustrations of aggregate returns and do not reflect the performance of any actual investment. Investors cannot invest in an index and do not reflect the deduction of the advisor’s fees or other trading expenses. There can be no assurance that current investments will be profitable. Actual realized returns will depend on, among other factors, the value of assets and market conditions at the time of disposition, any related transaction costs, and the timing of the purchase. Indexes and benchmarks may not directly correlate or only partially relate to portfolios managed by SL Advisors as they have different underlying investments and may use different strategies or have different objectives than portfolios managed by SL Advisors (e.g. The Alerian index is a group MLP securities in the oil and gas industries. Portfolios may not include the same investments that are included in the Alerian Index. The S & P Index does not directly relate to investment strategies managed by SL Advisers.)
This site may contain forward-looking statements relating to the objectives, opportunities, and the future performance of the U.S. market generally. Forward-looking statements may be identified by the use of such words as; “believe,” “expect,” “anticipate,” “should,” “planned,” “estimated,” “potential” and other similar terms. Examples of forward-looking statements include, but are not limited to, estimates with respect to financial condition, results of operations, and success or lack of success of any particular investment strategy. All are subject to various factors, including, but not limited to general and local economic conditions, changing levels of competition within certain industries and markets, changes in interest rates, changes in legislation or regulation, and other economic, competitive, governmental, regulatory and technological factors affecting a portfolio’s operations that could cause actual results to differ materially from projected results. Such statements are forward-looking in nature and involves a number of known and unknown risks, uncertainties and other factors, and accordingly, actual results may differ materially from those reflected or contemplated in such forward-looking statements. Prospective investors are cautioned not to place undue reliance on any forward-looking statements or examples. None of SL Advisors LLC or any of its affiliates or principals nor any other individual or entity assumes any obligation to update any forward-looking statements as a result of new information, subsequent events or any other circumstances. All statements made herein speak only as of the date that they were made.
Certain hyperlinks or referenced websites on the Site, if any, are for your convenience and forward you to third parties’ websites, which generally are recognized by their top level domain name. Any descriptions of, references to, or links to other products, publications or services does not constitute an endorsement, authorization, sponsorship by or affiliation with SL Advisors LLC with respect to any linked site or its sponsor, unless expressly stated by SL Advisors LLC. Any such information, products or sites have not necessarily been reviewed by SL Advisors LLC and are provided or maintained by third parties over whom SL Advisors LLC exercise no control. SL Advisors LLC expressly disclaim any responsibility for the content, the accuracy of the information, and/or quality of products or services provided by or advertised on these third-party sites.
All investment strategies have the potential for profit or loss. Different types of investments involve varying degrees of risk, and there can be no assurance that any specific investment will be suitable or profitable for a client’s investment portfolio.
Past performance of the American Energy Independence Index is not indicative of future returns.
less
How did you like this article? Let us know so we can better customize your reading experience.


