
Why Is The U.S. Treasury Yield Curve U-Shaped And Why Did The Treasury Buy Back $10 Billion In Notes?

Image Source: Pixabay
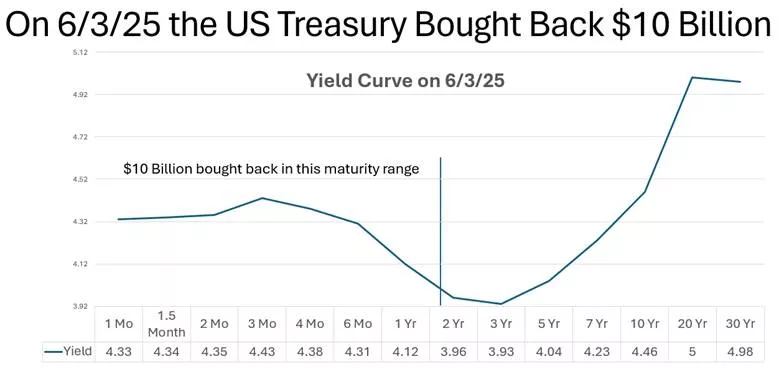
Here’s the US Treasury yield curve as of 6/3/25, and the maturity range that was bought back on that day.
I have 2 questions. I can only guess at the answers. What are your answers?
- Why is the yield curve U-shaped? I asked AI for examples of previous U-shaped curves, and it couldn’t report any. Instead, it said they are “rare.” AI provided several possible explanations for the current U-shape, like supply-and-demand and investor inflation expectations, but without a precedent we just can’t tell.
- Why did the Treasury buy back $10 Billion in short-to-intermediate bonds? The Treasury’s previous largest buyback happened in 2000, at approximately $3 billion. The 6/3 buyback is big.
I have a possible explanation for this buyback – it was to save money. My guess is that the Treasury issued notes in the 2-5 year maturity range at 4% interest to finance the buyback of bonds that paid 4.4% at the near-dated end of the curve. The 0.4% savings on interest is $40 Million on $10 Billion in redeemed bonds. You’d think that supply-demand considerations would have flattened out the yield curve following the buyback, but it didn’t, so maybe my guess is wrong and/or $10 Billion just isn’t enough to move the needle.
Conclusion
This is short because I have no solid answers. I merely want to present the puzzle and start a conversation. It appears that the current U-shape is unprecedented in the US as is the recent buyback. This hasn’t happened before.
What do you think is going on here? There is a story. What is it?
More By This Author:
401(k) Warns Baby Boomers In Target Date Funds To Get Out
Democracy Fails When The Majority Are In The Cart.
A Warning To Baby Boomers And Others Regarding The China-US Trade War And Interest Rates


