
When Fantasy Meets Reality

Image Source: Pixabay
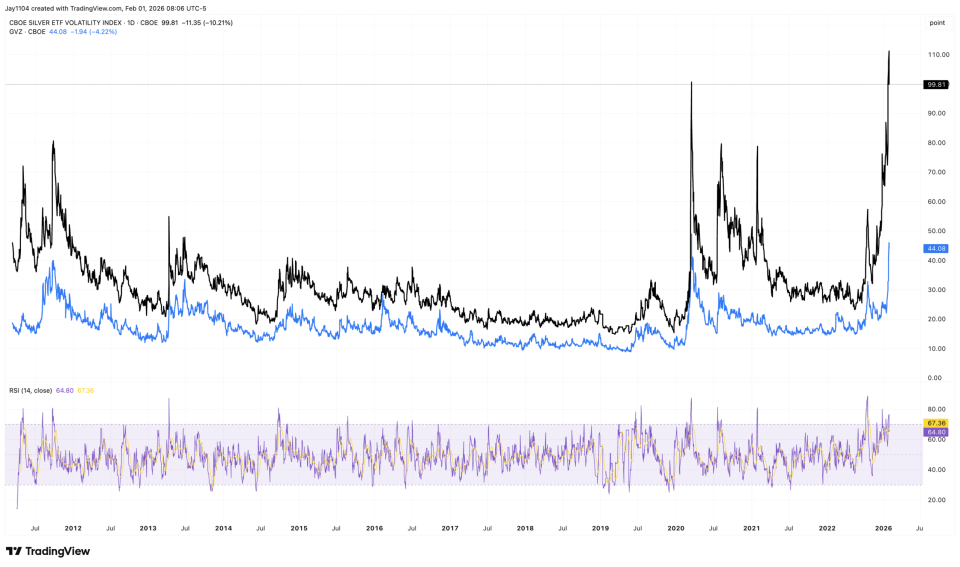
The price action in metals on Friday was one for the record books. Silver plunged by more than 26% and was down over 30% intraday. Gold was not much better. The metal often described as a safe haven or store of value fell by roughly 9%.
Sorry to be the one to say it, but safe-haven assets do not trade with implied volatility of 99.8% and 44%, respectively. Notably, the implied volatility of the GLD ETF fell alongside the price decline on Friday, as did that of the SLV ETF. That is not something you see very often, particularly during a move of this magnitude.
Given how elevated implied volatility remains, it is hard to argue that the volatility and price swings in gold, silver, and other metals are over. It would not be surprising to see either metal rise on Monday, nor to see them fall.
I have followed these metals, along with others, for years, and I have never found a reliable way to value them. What I do know is that there is always a narrative attached. For copper, the supply-and-demand imbalance is typically driven by uses ranging from housing to electric vehicles. For silver, the story is similar, only now EVs are replaced with AI. And for gold, it is always some version of the inflation or end-of-the-dollar story, a narrative that has been circulating as long as I can remember.
(Click on image to enlarge)
There is a great story on FT.com today about 47th Street. Jewelers there are seeing so many people looking to sell gold and silver that buyers are reportedly running out of physical cash. It is a reminder that, in the end, demand for US dollars is what truly matters, because dollars are the only currency you can reliably use to buy essentials like food and to pay rent.
Ultimately, gold and silver are nothing more than risk assets, just like everything else. My view has always been that if you buy gold or silver, it should be in the form of jewellery. If prices rise over time, that is a bonus, and if they do not, at least the asset provided some utility—either to you or to someone you care about. Otherwise, these assets carry much the same inherent risk as most other financial investments. Yes, silver has industrial uses, as do copper, platinum, and palladium, but again, we are not in a fundamentally sound investment stage; this is pure speculation.
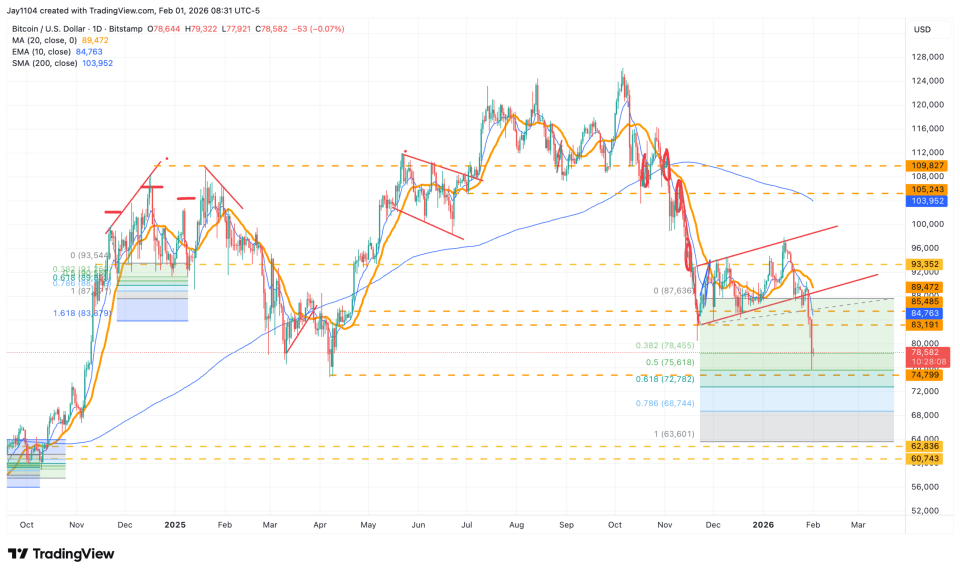
The same logic applies to Bitcoin, except that Bitcoin is ultimately a worthless asset. It has value only because a group of people believes it does. Once again, Bitcoin has proven to be no hedge at all and instead reflects little more than the ebb and flow of liquidity. At present, liquidity conditions appear to be tightening, and if the technical pattern is any guide, Bitcoin likely has further downside ahead. A break of $73,000 could open the door to a move toward the $60,000 support level.
(Click on image to enlarge)
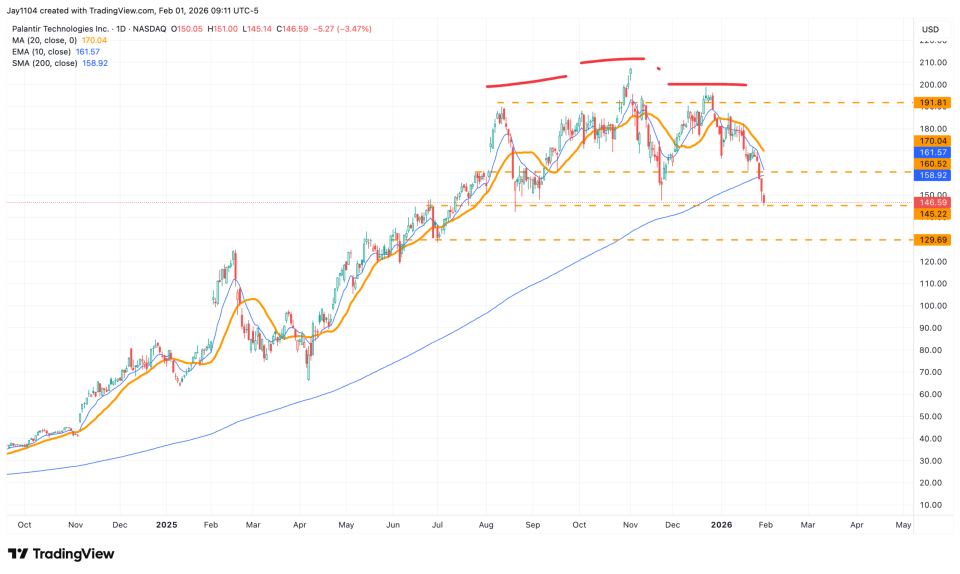
Palantir is another stock with a compelling long-term “story”, and that “narrative” will take center stage again on Monday when the company reports earnings. However, the technical setup is not particularly attractive. Shares are trading below the 200-day moving average and are sitting on support around $140, with what appears to be a head-and-shoulders pattern developing.
The stock is pricing in a post-earnings move of roughly 8.9%, with implied volatility above 90% for options expiring on Friday, Feb. 6.
(Click on image to enlarge)
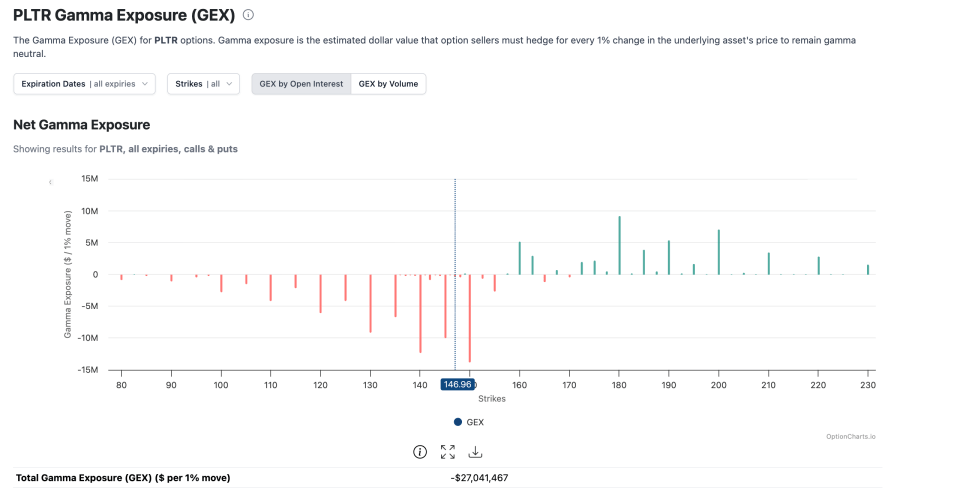
Gamma positioning is negative, which means market makers are likely to trade directionally with the stock. That remains the case below roughly $160, where gamma flips positive, and market makers would instead become sellers into strength. That would be a resistance level for the shares should it rise.
(Click on image to enlarge)
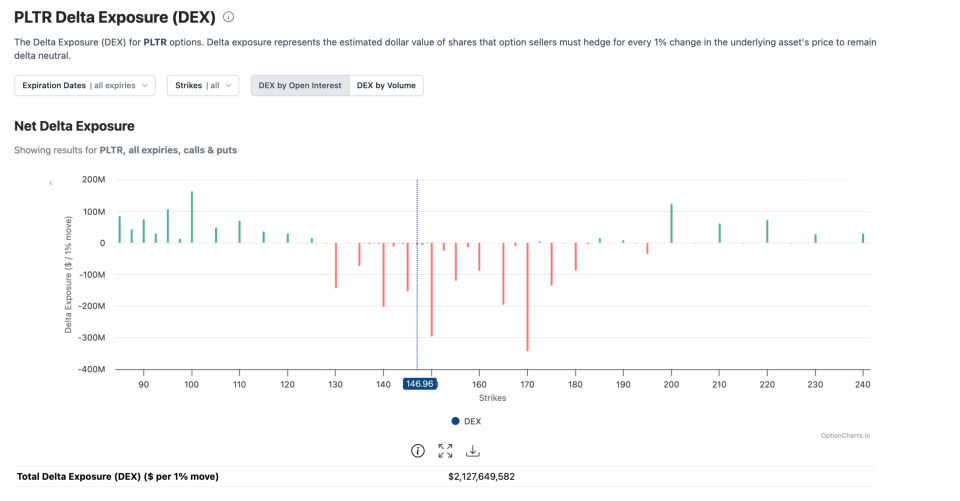
Image Source: Optioncharts.io
In addition, there is a large build-up of put delta at the $150 and $170 strikes. That suggests a significant amount of put premium that could be burned off once earnings are released and implied volatility collapses. On the surface, this might suggest a higher share price after the results.
However, the $170 puts are trading around $24.50 for the Feb. 6 expiry, meaning the stock needs to fall below roughly $145.50 for buyers to begin making money. Because these puts are already deep in the money, they will not experience much premium decay after earnings. As a result, there is little delta to unwind.
With the stock already in a negative-gamma regime, this lack of delta unwinding could reinforce downside pressure. That outcome aligns with the technical picture, suggesting that, absent a meaningful upside surprise, the shares could fall toward the mid-$120 range following earnings.
(Click on image to enlarge)
Image Source: Optioncharts.io
Anyway, that is all for today.
More By This Author:
Liquidity Drain May Signal Further Trouble For Risk Assets
The Liquidity Drain Appears To Have Resumed
Fed Steady, Earnings Mixed, And Oil Takes Center Stage
This report contains independent commentary to be used for informational and educational purposes only. Michael Kramer is a member and investment adviser representative with Mott Capital Management. ...
more

