
Let’s talk about a counter trend rally as it applies to the stock market. The SPDR S&P 500 Trust ETF mirrors the S&P 500 and its price action and for swing traders trying to predict and capture its price swings and understand the nuances of trend and technical analysis is crucial for making good trading decisions that keep reward/risk front and center.

With the recent selling seen across the board and the subsequent hard bounce that SPY (as well as QQQ and IWM) has seen over the past two weeks, understanding trends and counter trend moves in the indices is critical to understanding the bigger picture.
What I want to do here is analyze some of the early movements in SPY going back to the stock market correction that lasted nearly all of 2022 and how easy it was in the early stages, to believe that the worst was behind it.
Those charts from early ’22 reveal an important lesson: what appears to be a bullish breakout can sometimes be a deceptive move within a larger downtrend. As a result, I’ll be exploring this period and how it may relate to the current market bounce that is underway and to better illustrate this phenomenon and provide some valuable insights for you.
The False Breakout of Early 2022
Breaking Down the Apparent Breakout
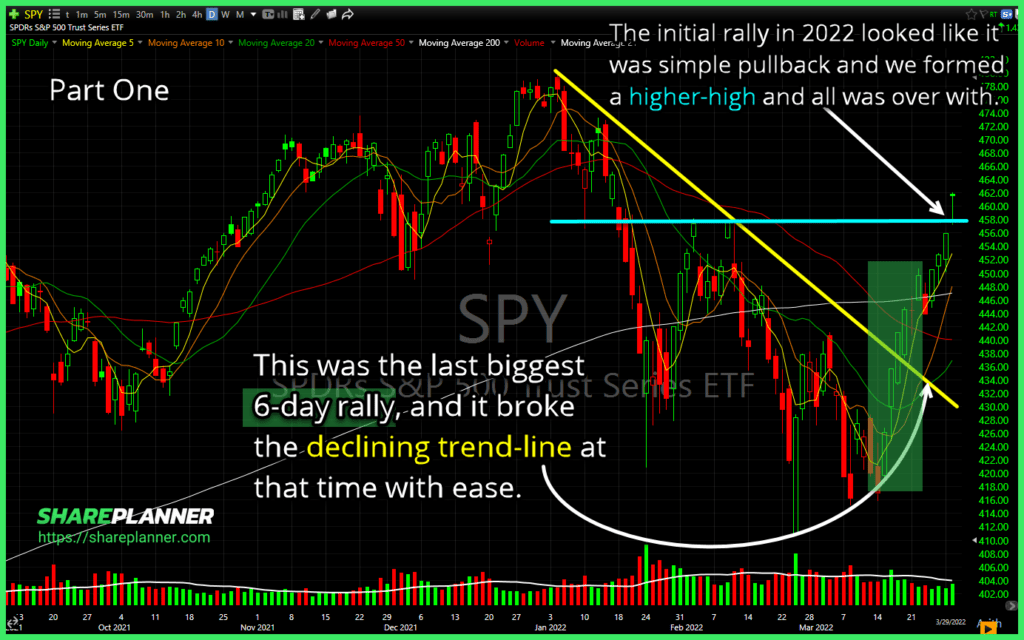
In the early months of 2022, SPY experienced a decline of over 14% before bottoming out and bouncing. After the bottom, SPY showed promising signs of an upward breakout that caught the attention of many swing traders claiming that the market had bottomed, with price action ultimately forming what appeared, at that time, to be a higher high, a signal suggesting a potential trend reversal. What ensued was a +12% counter trend rally off of the then-lows.
The combination of these factors led many traders to interpret this as a bullish signal, expecting the upward momentum to continue back to all-time highs. It’s easy to see why this move was so enticing – after a period of decline, such a decisive break above the previous lower-high is necessary to establish a new trend, but this wasn’t the trend you thought it was.
Misguided Short-Term Analysis
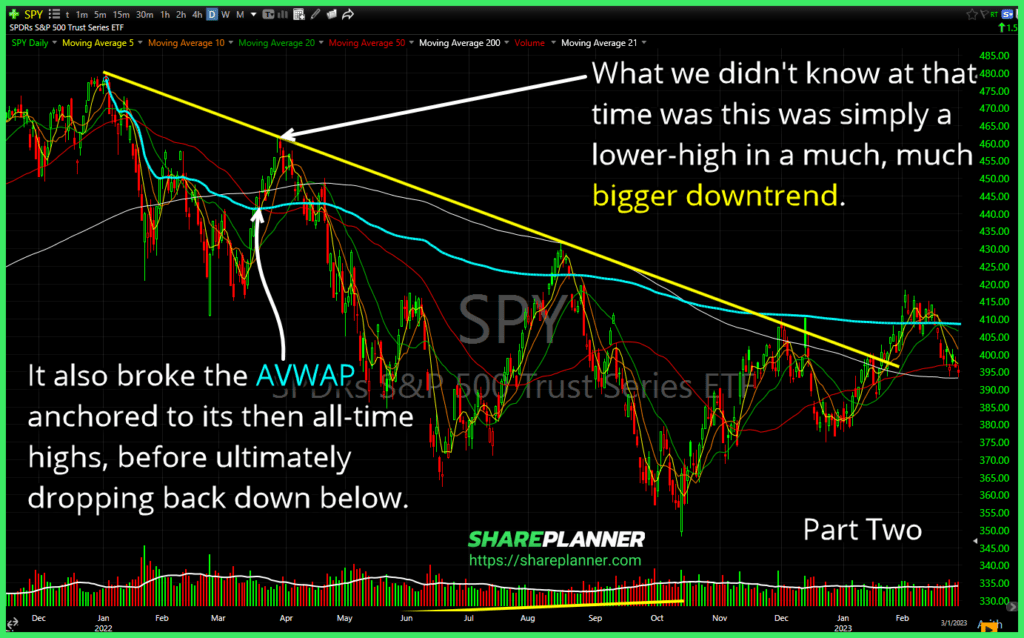
This breakout proved to be short-lived, serving as a stark reminder of the dangers of focusing too narrowly on short-term price action, without also taking into account long-term price action, because what seemed like a higher high in the context of the previous two months was, in fact, just another lower high that was being established in the grand scheme of a much bigger downtrend.
This scenario highlights the importance of maintaining perspective when analyzing market trends. While short-term analysis is valuable for timing entries and exits, it must always be balanced with a broader view of market conditions.
Revealing the Bigger Picture
Zooming Out for Clarity
The second chart tells the continuation of this story and how this counter trend rally ultimately plays out. What initially appeared to be a reversal was, in fact, just a lower-high being formed within a much broader downtrend. SPY not only failed to sustain its upward momentum but ultimately broke the Anchored VWAP (AVWAP) anchored to its then all-time highs.
This breakdown below the AVWAP is particularly telling. It shows that despite the brief rally, the broader market sentiment remained bearish. The price action that followed reaffirmed this, as SPY eventually dropped back down, continuing its descent as well as breaking the March lows, with much steeper lows that didn’t experience another short-term bottom until June of later that year.
Key Takeaways for a Counter Trend Rally
For swing traders, these charts serve as a critical reminder that a broken downtrend is not always a sign of recovery. It’s essential to consider the larger market context and be cautious of short-term higher highs that may be just a part of a broader, and much bigger downtrend.
In the case of SPY, the initial breakout above the declining trend line in early 2022 was a false signal. The subsequent higher high in the short-term ultimately became a lower high in the long-term, leading to a breakdown below the AVWAP, which highlighted the importance of looking beyond short-term rallies and focusing on the bigger picture.
The Art of a Counter Trend Rally
The SPY ETF’s price action in 2022 serves as a valuable lesson in the importance of placing a counter trend rally in context. While short-term rallies can be enticing, it’s crucial to step back and consider the bigger picture. By doing so, swing traders can avoid the pitfalls of false breakouts and better align their strategies with the true market trend.
Remember, there’s a reason why these counter trend rallies are called dead cat bounces!
Successful trading isn’t just about identifying patterns – it’s about understanding the context in which those patterns occur. By developing the skill to interpret market movements within their broader context, traders can make more informed decisions and potentially improve their overall performance.
SPY’s price action in early 2022 is a textbook example of how a seemingly positive breakout can be really misleading. For swing traders, the lesson here is to remain vigilant and keep an eye on not just the short-term action but also the long-term price action when doing market analysis. Always consider the larger trend and use multiple indicators, like the AVWAP, to confirm the strength and direction of a move.
As you approach your next trade, remember to zoom out, consider multiple timeframes, and always be prepared for the market to reveal a larger story than what first meets the eye.
More By This Author:
Finding A Trader To Follow
Taking Profits In A Stock Market Correction
When Stocks Tumble


Comments
Log in or sign up to join the conversation.