What’s Working In 2015?
The market has been flat so far.
Doesn’t feel like it with all the drama in the headlines, but this just happened.
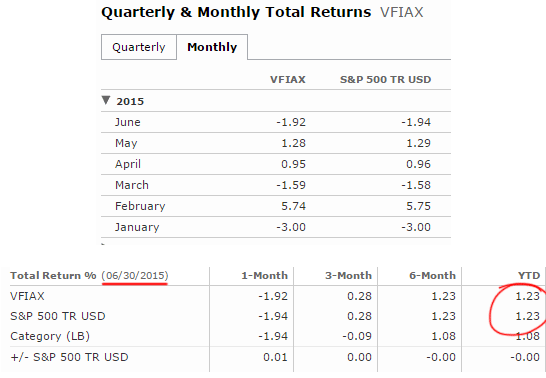
S&P500 and ETF Comparison
February was a great month but other than that, it’s been up and down.
I use these screens as a personal way to gauge the market as a whole, the screens cover several different strategies. So when I see the majority of the screens under performing the markets, it’s a sign that things are tough out there and serves as a reminder to focus on valuation and patience in order to maintain a successful portfolio.
So What’s Working in 2015?
Not much according to what I’m seeing via the various value strategies I follow.
Here are the performances for each value screen at the end of Q2.
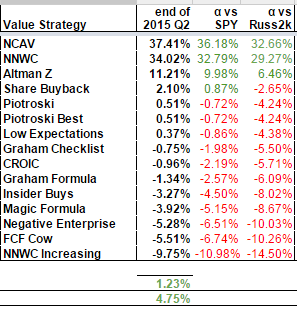
End of Q2 Performance Results
The Year of Net Nets?
The NCAV and NNWC screens are smoking the market at 37% and 34% this year respectively, but there’s an issue with the performance.
The first problem is that the NCAV and NNWC aren’t tracking a full list of 20 stocks.
The NCAV list started off the year with only 8 stocks while the NNWC started with 12 stocks.
Some keen observers have asked why there are more stocks in the NNWC screen when it’s more restrictive, and why all the NNWC stocks aren’t included in the NCAV.
If I ran a simple straight selection criteria, there would be more stocks in the NCAV screen, and all the NNWC stocks would be listed in the NCAV list.
However, since I’ve created custom criteria for both the NCAV and NNWC, the list is not equal.
The second problem is that both portfolios include Voltari Corp (VLTC) which ended Q2 up 700%. It was up 2350% at one point.
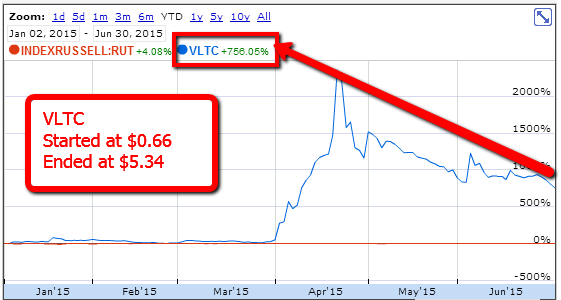
But why is this an issue?
If you had a 100k portfolio to start the year and needed to buy $10k worth of VLTC at $0.66 a share, it would have been tough to buy 15k shares as the volume at the beginning of the year was between 30k to 50k shares a day.
That’s assuming you were the only one who knew about VLTC.
If my lists were published for all to see, you would be competing to buy the same shares along with 10, 20 or 50 other people.
50 x 15k shares per person = 750k volume required.
So the lesson here is not to get glittery eyed by big performance numbers as it’s hard to replicate.
I try my best to include as much fees and real life deductions as possible in the screens, but there’s a limit to how much complexity I can model.
Other screens you see on the net claiming 40%+ returns YTD are hocus pocus.
Regarding diversification, when it comes to net nets, a portfolio made up of 10 is still too risky unless you do some deep research to make sure a few won’t blow up.
For a good mix of net nets, you should have at least 20 because net net stocks by nature aren’t high conviction or concentrated bets.
You do well when you buy a basket.
You go bankrupt when you go all in on a couple.
I usually buy individual net nets when the market has plenty of offerings, but even then, I’m not willing to put more than 5% into a net net position.
The Real Outperformer of 2015
Now if you exclude the NCAV and NNWC from the performance list, that only leaves the Altman Z stocks outperforming the market.
For the Altman Z screen, I ignore financials, utilities and mining.
Here’s another look at the Q1 and Q2 side by side.
Click on picture to enlarge
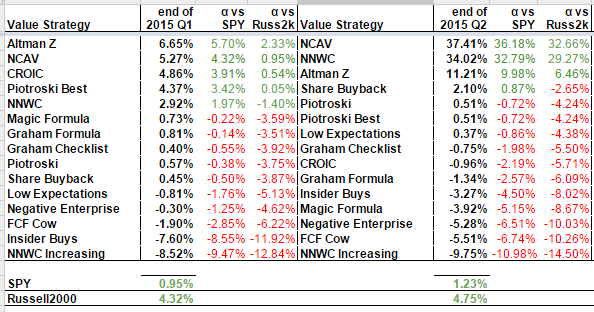
Q1 and Q2 performance
The Altman Z Stocks as of June 30, 2015
Here are the 20 stocks that make up the Altman Z screen for 2015 sorted by performance.
Click on picture to enlarge
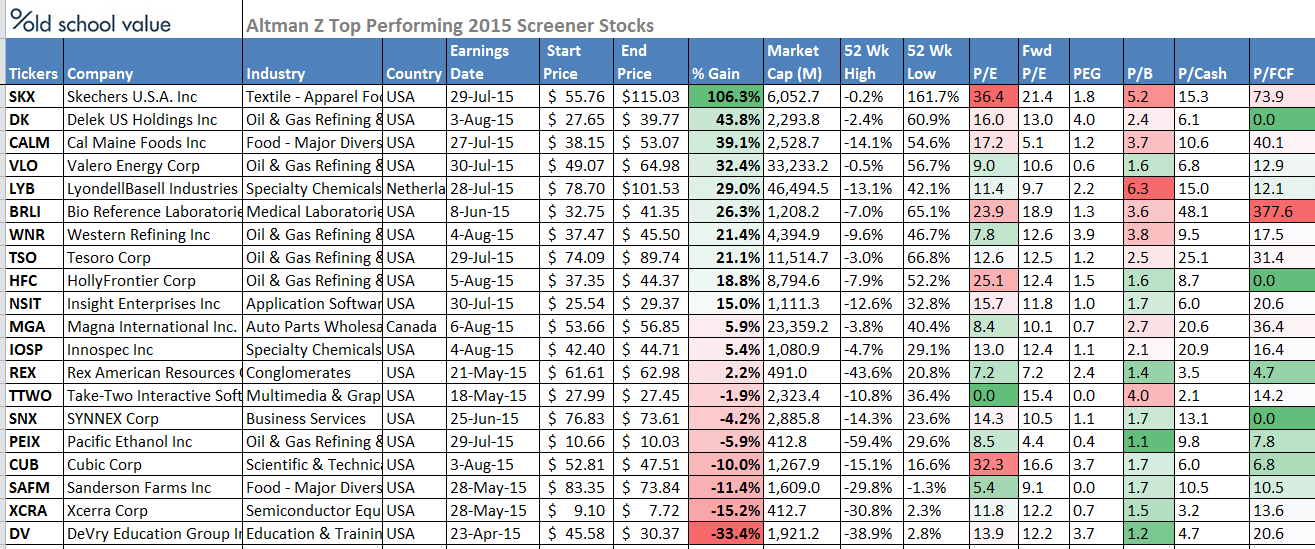
2015 Q2 Altman Z Stocks
The biggest loser is DeVry (DV) and it’s not a surprise considering that the entire for profit industry has been smashed.
Looking back at when I held Strayer (STRA) last year, I’m lucky to have gotten out with a 40% gain as the industry is just horrific. You have to be on the edge of your seat with the for profit sector as anything can happen at any time.
Another stock that I’m glad to see in green which I currently hold is Cal-Maine Foods (CALM).
This isn’t a typical value play.
Most of the value is being derived from the increase in egg prices due to an outbreak of bird flu which I heard about at the beginning of the year.
This is more of a supply and demand scenario, and this was definitely luck on my part. I’m not a huge commodity stock investor because of the constant need to monitor the market, egg prices, demand, affects on supply chain, what customers are willing to pay, trend in consumer eating habits and so on.
And I’m not a fan of trying to time the commodity cycle, but I’ll take it here.
Disclosure: None.


ok looking at what you ended up with is a good list..HOW you got there is what's so confusing to me..and what do we do with that list now? are you still long any of these? are you all out? is this your basket that you are holding? thanks I own quite a few BTW..cheers