
Two days ago - when looking at the latest card (credit and debit) spending data- we cautioned that today's retail sales report would "shock" by coming in red-hot, and would be the biggest jump in more than two years ...
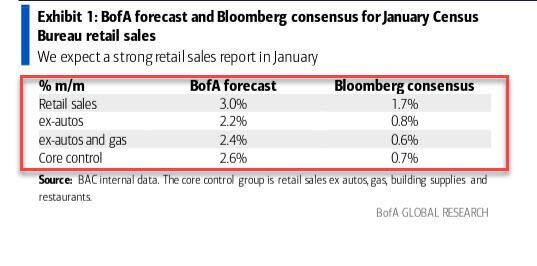
... and this morning that's precisely what happened, when retail sales printed in exactly as we previewed, surging by 3.0% in January, the most since March 2021...
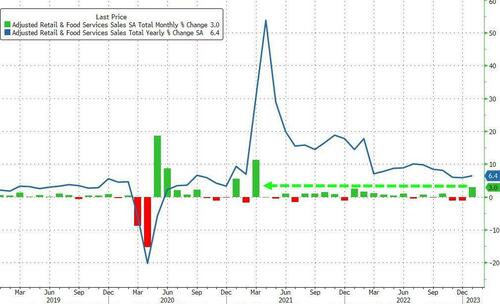
... and a whopping 2.3% ex autos. Remarkably, every single category shot up, the first time we have seen that since the covid crash.
(Click on image to enlarge)
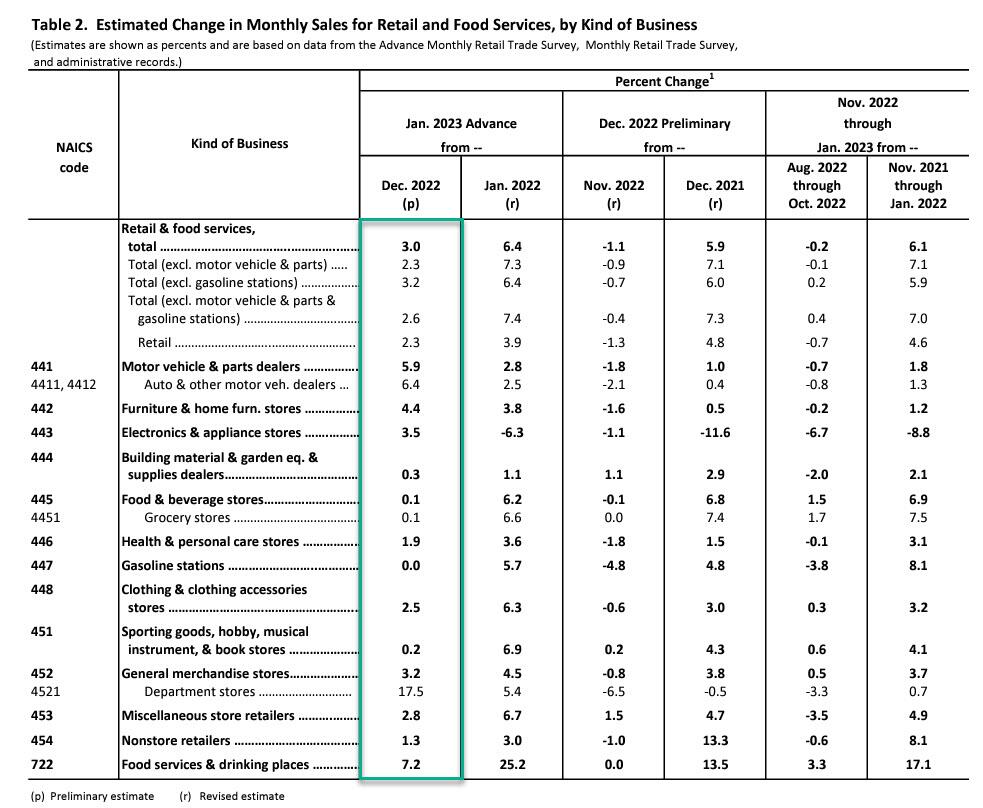
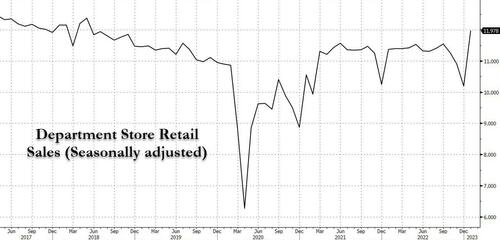
Not just that, but department store sales, that melting ice cube of retail spending, saw the biggest surge in almost five years.
So is this the start of a new economic renaissance, one which hilariously begins just as the 2s10s curve hit the most inverted in 40 years this morning, touching a Great Depression 2.0 signaling -89bps...
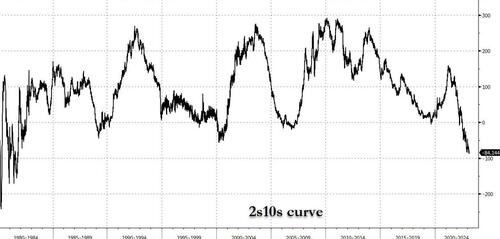
... and prompting questions if Erdoganomics is in fact the way the world actually works.
The answer, as we also explained earlier this week, is no. In fact, the entire surge in January retail sales has to do with one-time factors which are unlikely to repeat.
First, is seasonals. As Goldman wrote yesterday in its preview, the surge in the print is due to a "pretty healthy seasonal boost." Specifically, much of "the December weakness was driven by unusually punitive seasonals, and in Jan we get that back- the seasonal drag in Dec turns to seasonal boost in Jan." Bank of America agreed, having flagged last month that since the start of the pandemic, holiday spending has become more front-loaded, and so the spike in spending in December has become smaller on a not seasonally adjusted (NSA) basis. As a result, the NSA decline in spending in January has also become smaller. However, seasonal adjustments are still largely based on pre-Covid spending patterns. Therefore, on a seasonally adjusted basis, January retail sales have been exceptionally strong since the start of the pandemic. Translation: just like the blowout jobs report was entirely due to seasonal adjustments, so too the red-hot retail sales report will be largely a function of various excel data transformations.
The second driver of strong spending in January was the increase in disposable personal income (DPI) due to robust labor market gains and various inflation-related adjustments. The most notable of these was an 8.7% cost-of-living adjustment (COLA) to social security benefits, which alone likely raised DPI by around 0.5% in January. The COLA was announced last October. Starting in November, spending has been meaningfully stronger among older HHs than younger HHs.
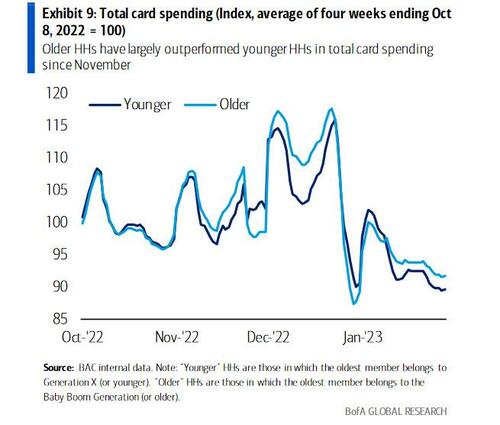
There is no similar pattern in the pre-Covid data:
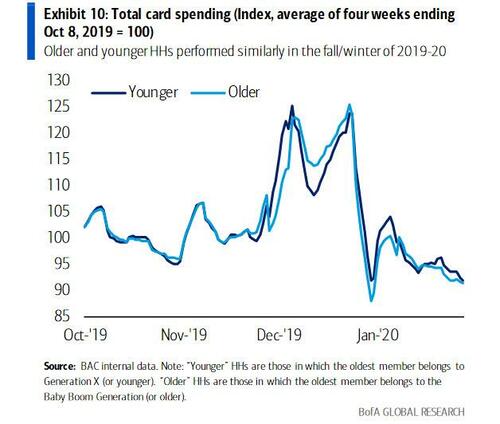
The outperformance of older households was concentrated in retail in November...
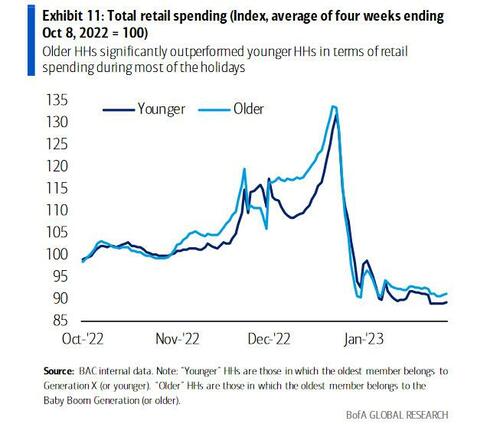
... but spread to some services categories in December-January.
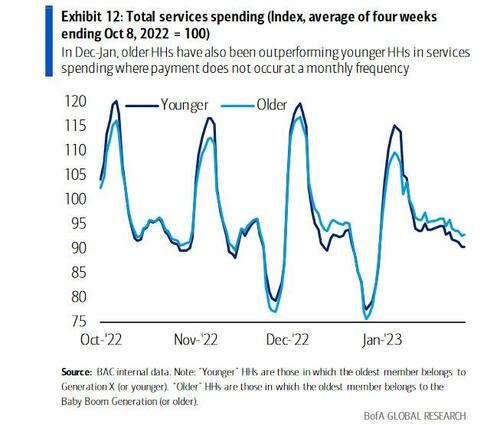
In Bank of America's view, it is likely that some older households boosted spending over the holidays in anticipation of receiving the COLA in January. Others might not have been aware of the COLA until it went into effect. Therefore, the uptick in spending for the older HHs could extend into at least February.
A third and final reason for the pickup in spending in January could be that consumers were holding back on spending in anticipation of large post-holiday clearance sales. This ties in with the fact that some of the weakest categories in December – furniture, clothing, general merchandise and department stores – saw significant payback in January.
In conclusion, as we wrote on Monday, there are good and bad news.
-
The good news: the factors discussed above support the view that US consumers remain resilient (largely thanks to record credit card spending but that's the topic of another post) which should help the US avoid a recession in the first half of 2023, but not in the second half.
-
The bad news is that, similar to the January payrolls report, the underlying drivers of strong January data (in this case spending) are all one-off factors or level-shift effects that will not lead to an extended acceleration in economic activity.
There is one final point, and this one is anything but good. Goldman reminds us that in forecasting future retail sales, readers should keep the expiration of SNAP Benefits in mind (more in this report for pro subs). For 2023, Goldman estimates total SNAP benefits to decline by ~7% y/y, with ~6% growth in Jan/Feb and ~8% average declines in Mar-Sep, noting a partial offset from the +12.5% cost of living adjustment (COLA) on the base benefit which began in Oct 2022.
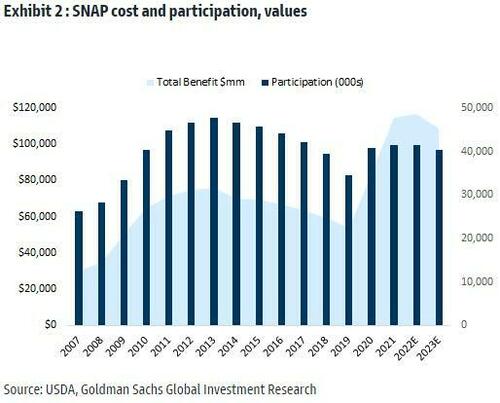
In other words, after a front-loaded surge now, we will see a gradual drop in the coming months as consumers - especially in lower income brackets - become increasingly squeezed.
More By This Author:
US (Nominal) Retail Sales Soared In JanuaryCore CPI Rises 32nd Straight Month, Headline Inflation Hotter Than Expected YoY Driven By Lagging Shelter
NatGas Slides As Mild Weather Trumps Freeport LNG's First Cargo Since June Blast


Comments
Log in or sign up to join the conversation.