
What Types Of Bonds Are Attractive In A Rising Rate Environment?
Bonds are an important part of portfolios, even if in small amounts. They serve to moderate volatility and minimize maximum drawdowns. Over the past 35 years, bonds have generated interest income and capital appreciation as interest rates declined from very high to very low levels. We are now in a period of rising interest rates, in which bonds with fixed payments will generate interest income and capital depreciation.
The short answer now, in terms of publicly traded funds, is floating rate bank loans, below investment grade corporate bonds, preferred stocks and limited-term municipal bonds – noting that there are significant risks with floating rate bank loans and below investment grade bonds if the economy deteriorates.
We come to this conclusion by preferring those bond fund types that have both a current real, after-tax yield; and that would be expected to have a positive total return in a period where their yield rises by 1% to keep abreast of the market.They are shown in “Performance Group A” in this table.
(Click on image to enlarge)
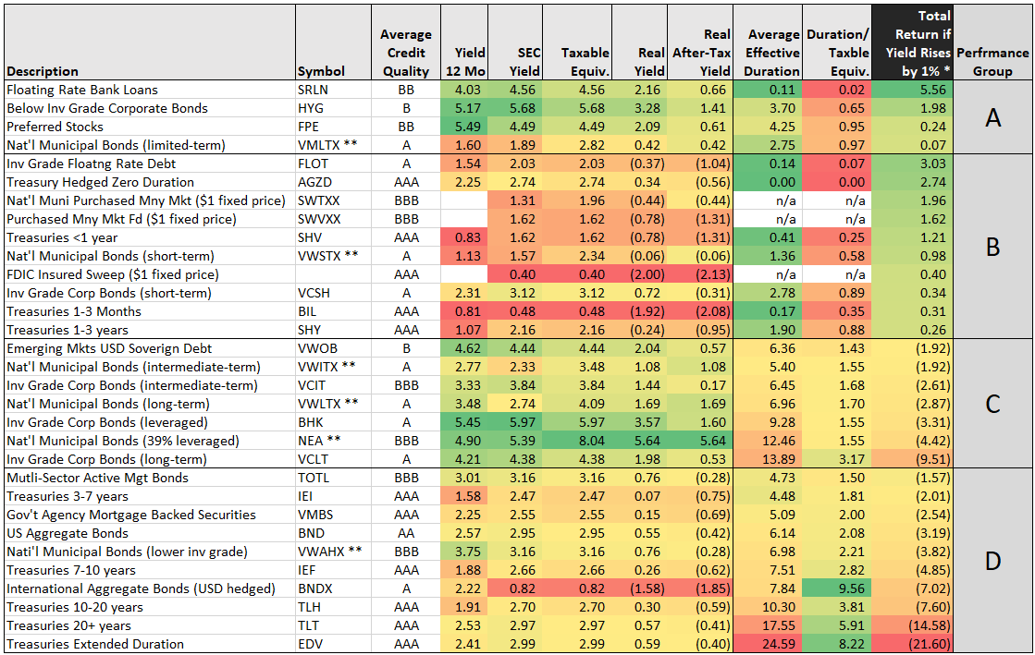
Performance Group B has a positive total return in a period with a 1% yield increase, but does not have a real, after-tax yield.Performance Group C has a real, after-tax yield, but is expected to have a negative total return in a period with a 1% yield increase.Performance Group D has a negative outcome under both conditions.
We should also note that TOTL in Group D is an actively managed multi-asset fund that may be able to avoid the indicated outcome by modifying its composition.However, as of the last report it is in Group D.
If interest rates were to remain essentially where they are now, then there are attractive types in Group C.
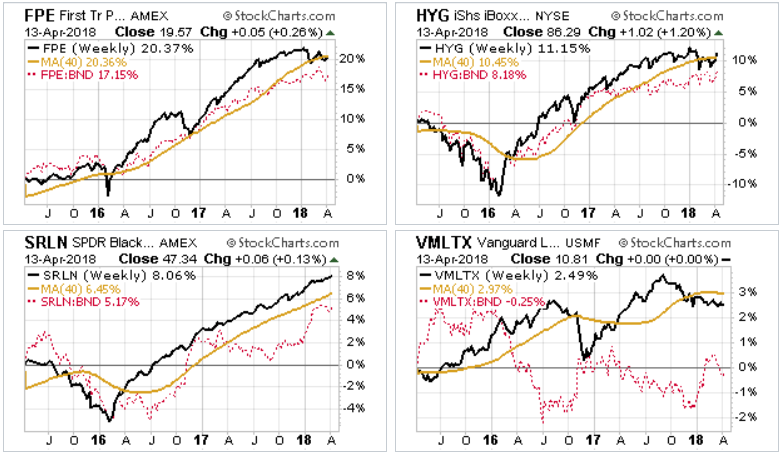
3-Yr Weekly Total Return Charts for Group A Funds
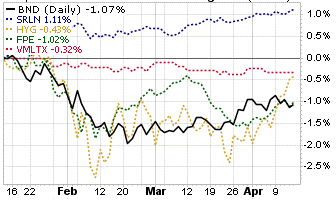
3-Mo Daily and 1-Yr Weekly Total Return Comparison Charts for Group A Funds vs Aggregate Bonds
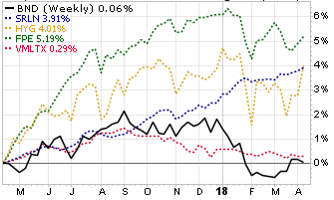
3-Year Weekly Total Return Charts for Group C Funds
Real, after-tax yield is a simple concept that we all understand: (yield) – (inflation) – (tax rate times yield).
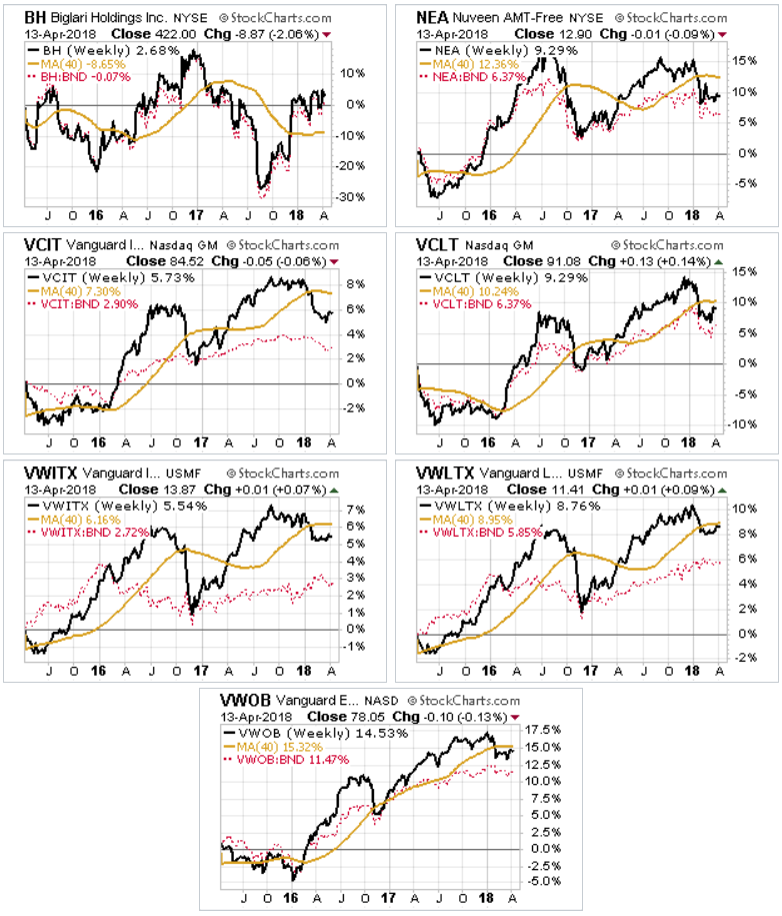
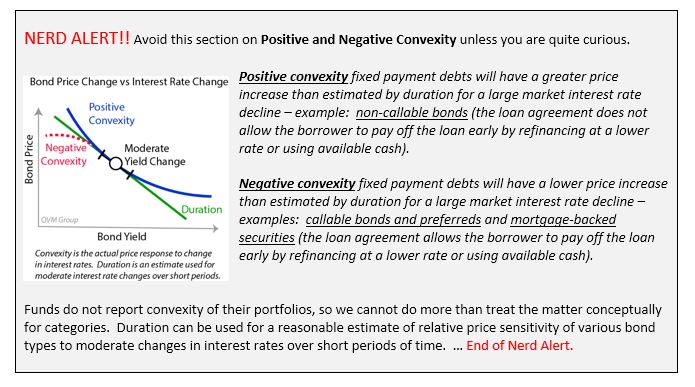
Total return when interest rates change is a less obvious function of duration.
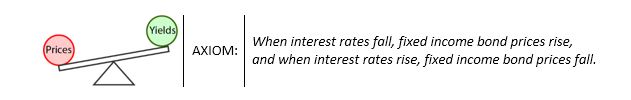
Duration estimates bond price change when the bond yield changes in response to change in market rates.The seesaw image next to the axiom illustrates the concept:yield up / price down; or yield down / price up.
Duration is a linear estimating tool for price change due to interest rate changes and is more accurate for small interest rates changes than for large interest rate changes. The actual relationship between bond price and changes in interest rates is curved and is called “Convexity”. We are assuming in this letter that duration is sufficient for reasonable estimates of bond price changes as interest rates change over the next 12 months. Those rate changes will be heavily influenced by the Federal Reserve raising its overnight rate, dropping out as a buyer of bonds in the open market, and non-reinvestment of its maturing bonds; as well as increased Treasury issuance because of the larger government deficit.
Credit Spread Risk:
With Treasury bonds, by definition there is no credit risk. The US government is assumed to always pay interest and redeem maturing bonds. They may do so with depreciated Dollars, but it is assumed that the nominal amounts will always be paid. Every other type of loan or bond has some level of credit risk – risk of not paying interest or defaulting on amortization payments or redemptions at maturity. They can be called “credit bonds”. Credit bonds have higher yields than Treasuries for any given maturity to compensate for risk.
The indication of credit risk for a bond is the “spread” between the yield of a Treasury of the same maturity and the credit bond (after adjusting for any call or prepayment features of the bond – Treasuries have no call or prepayment features).
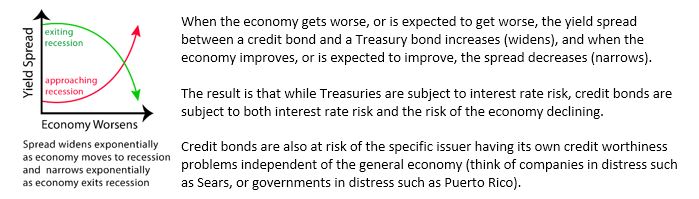
Recap:Treasuries are subject to interest rate risk. Credit bonds are subject to interest rate risk, economic risk and issuer specific creditworthiness risk.
Bond funds solve the issuer specific creditworthiness risk by massive diversification among issuers. That is something you cannot do. When you own individual bonds, you assume higher risk in this dimension than owning a bond fund. Bond funds also provide assured daily liquidity which is not available for man/most bonds. Total return, multi-sector bond funds can moderate the interest rate risk, and economic risk and issuer specific creditworthiness risks.Index credit bond funds take on all those risks.
Bottom Line:
Duration is a critical concept to understand as the secular declining interest rate environment of the past 35 years transitions to a secular rising interest rate environment.Interest rates are rising and are being driven by central bank policy reversals from QE (Quantitative Easing) to QT (Quantitative Tightening), and government fiscal stimulus policy.
Bond prices will decline to adjust their yield upward to market rates driven by Treasury yields.In some cases, the price decline will be greater than the yield, resulting in a one-time total return loss. However, bonds will still moderate volatility in portfolios and reduce the maximum drawdowns in equity Bear markets.
Cash that is earmarked for core bonds but tactically held in traditional fixed price $1 money market funds, will give the satisfaction of no price decrease, but will probably have a negative real return, and certainly have negative after-tax real return in regular taxable accounts.
Holding floating rate bank loans, below investment grade bonds, preferred stocks or limited-term municipal bonds will probably provide real returns; and will probably generate after-tax real return in regular taxable accounts; but with more price risk than core bonds if the economy goes into a recession. The municipal bonds are probably the least risky of the group, but also provide the lowest real after-tax return.
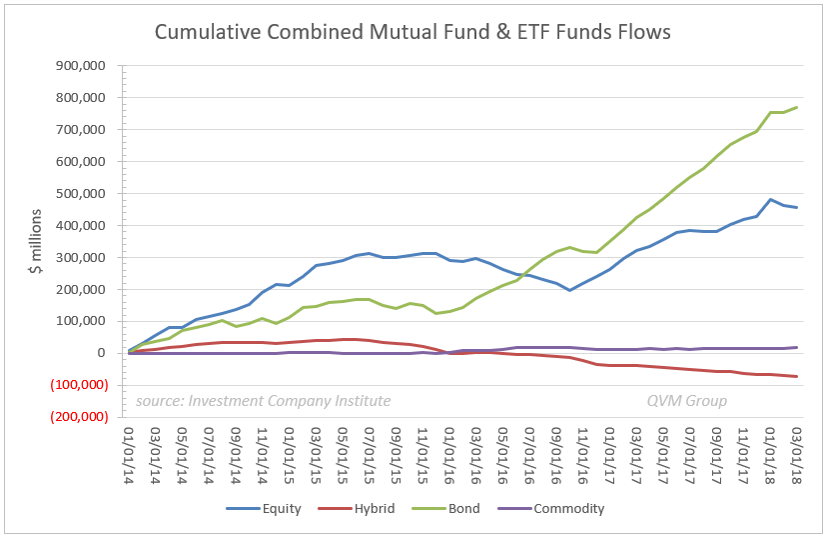
Asset Flows into Bond Funds Has Outpaced Flows to Equity Funds Over the Past 2 Years:
Investors reduced their net stock holdings in mutual funds and ETFs in 2016 and resumed net accumulation in 2017, but not at as high a rate as they accumulated bond mutual funds and ETFs.
We have been very light on bond fund holdings for a long time – well below our long-term strategic levels. We have been heavy on equities for a long time – above our long-term strategic levels.
In recent months, we have reduced our equity holdings back toward and in some cased below long-term strategic levels. We have not increased bond holdings over concerns about interest rate increase probabilities.
While we see reasonable room in portfolios for some of the bond types that may produce real after-tax returns and positive total returns, we are not prepared to put all our policy level strategic allocation into those types of funds, because they have too much credit risk sensitivity to the economy to be used as core holdings.
In the Long-Term Bond Funds Do Better Than the Static Picture:
In the long-run bond funds do better than the static picture in a rising rate environment because they have staggered maturities for reinvestment at higher rates, and they tend to have new money flows that they invest at higher rates; allowing them to stair-step their way into the higher yielding assets.
That is among the reasons that bond funds with no-loads and low fees are an attractive alternative to owning individual bonds. Doing it yourself, you have higher acquisition costs than funds, limited liquidity compared to funds should you need to sell, and far less credit risk diversification than funds.
Bonds Have Been Good for Portfolios Over the Long-Term and Will Be Again
We want to get more of the Fed’s tightening program behind us before committing to bonds, but long-term they need to be in our portfolios. Short-term, we are holding significant money market assets on a tactical basis driven by fundamentals.
Substantial bond holdings have moderated volatility and maximum drawdowns, as represented by worst calendar years in this table of 45-year returns (1973-2017), and bonds reduced the percentage of years with negative total returns.
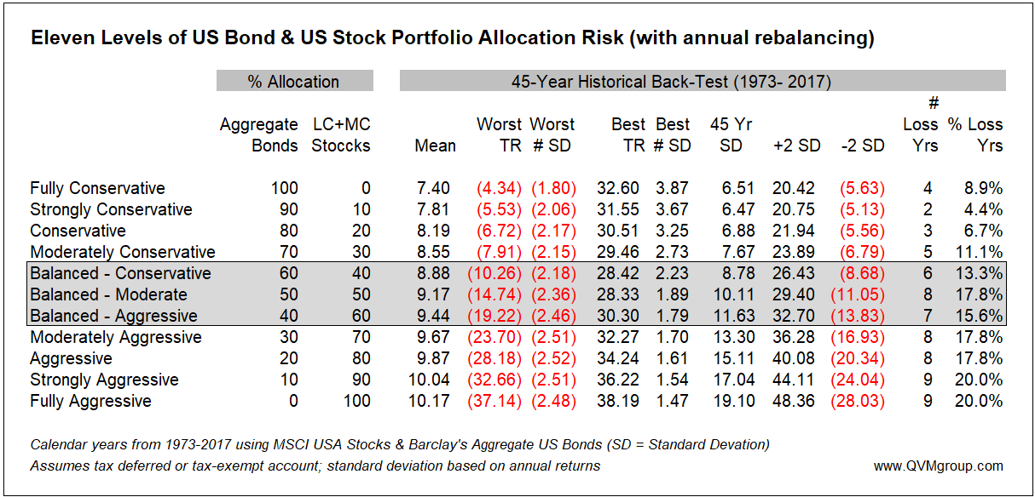
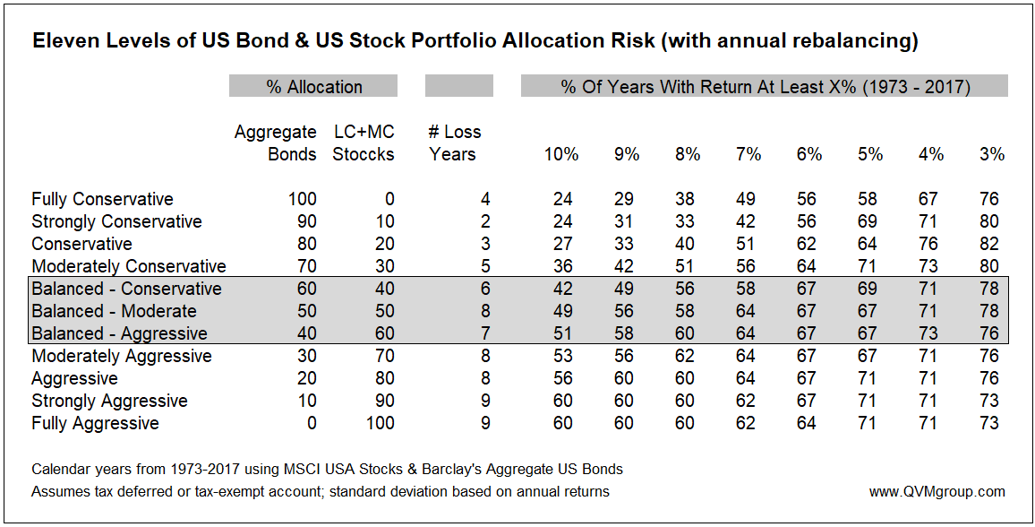
Bonds in portfolios had positive effects over long and short periods as shown in this table.
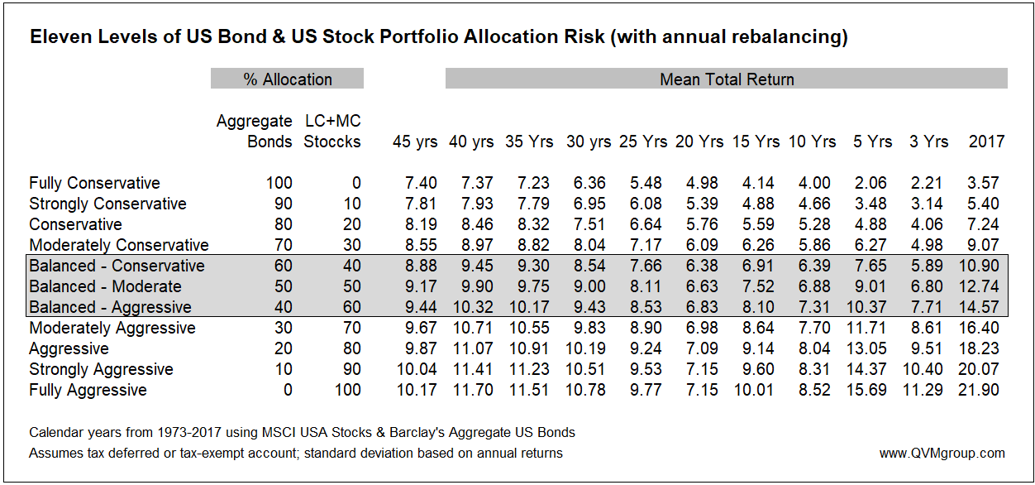
Moderate bond exposures in balanced portfolios have not substantially reduced the probability of achieving target return levels over the past 45 years, until the target reached 10% total return.
Note however, that consensus institutional 10-year forward projections are for lower returns than in the past.US large-cap stocks are expected to return in the range of 5% to 6%, and core bonds are expected to return around 3%. That implies balanced portfolios returning somewhere in the 4% to 5% range; compared to 6% to 7% over the last 10 years, and 9% to 10% over the last 40 years.
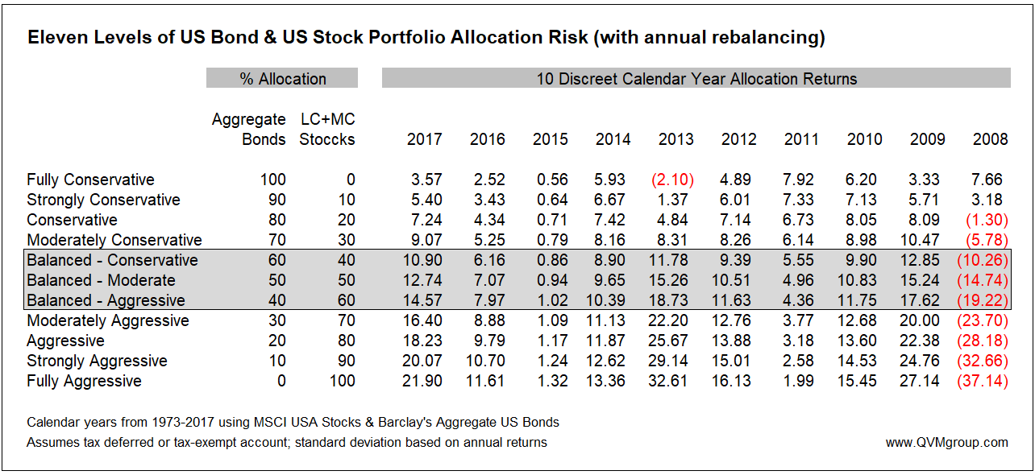
Bonds were a particularly helpful part of portfolios in the 2008 stock market crash, as this table of calendar year returns shows; with balanced portfolios declining 10% to 20% versus aggressive portfolios declining by 24% to 37%.
Relative Performance Quilt for Nine Bond Types and a Global Allocation:
The bond types most often in the top 3 in the 9 years from 2008 – 2017 were:
- Emerging Market USD Sovereign Debt (7 of 9)
- High Yield [below investment grade bonds] (6 of 9).
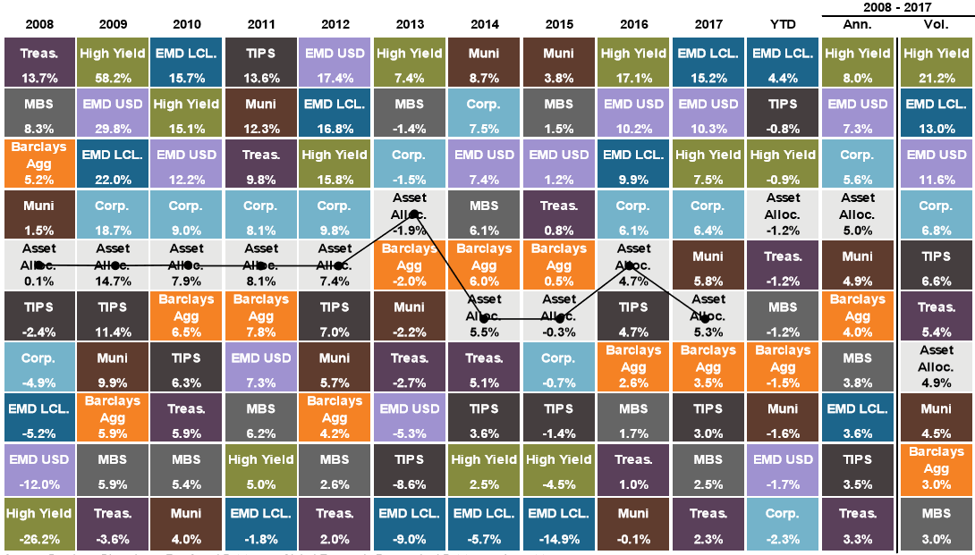
This table as of March 31 from JP Morgan Asset Management uses an Asset Allocation category defined as:
- 20% MBS (mortgage-back securities)
- 20% Corporate
- 15% Municipals
- 5% Emerging Debt USD (US Dollar denominated)
- 5% Emerging Debt LCL (local currency denominated)
- 10% High Yield
- 20% Treasuries
- 5% TIPS (Treasury Inflation Protected Securities).
The right-side column with “Ann.” as the header is the annualized return for the category over 9 years. The categories are ranked from highest to lowest annualized return.
The far-right column is the volatility of the category over 9 years ranked from most volatile to least volatile.
The asset allocation model produced a 5.0% return with a 4.9% volatility. The US Aggregate Bond index produced a 4.0% return with a 3.0% Volatility. These 4 categories had lower volatility than returns:Asset Allocation, Municipals, US Aggregate Bonds and Mortgage-Back Securities
Federal Reserve Rate Hikes:
This chart shows the history of the Federal Funds (overnight rate) and where the governors’ estimate it will be over the next few years.
The first observation is that the current rate although about 1.5% above the last few years, is still low by historical standards for a late stage economic recovery.
The second observation is that they expect the rate to more than double over less than 2 years (an increase of over 1.5%, which relates our focus on relationship between duration, interest rates and bond prices).
The yield curve may or may not shift up in parallel along all maturities, but it must shift up medium-term rates somewhat or the short-term rates will exceed to medium-term rates (“yield curve inversion”), and that almost always closely precedes a recession.
The Fed controls the short end of the yield curve with the Fed Funds rate, and the market controls the long end, and their forces interact in the middle.
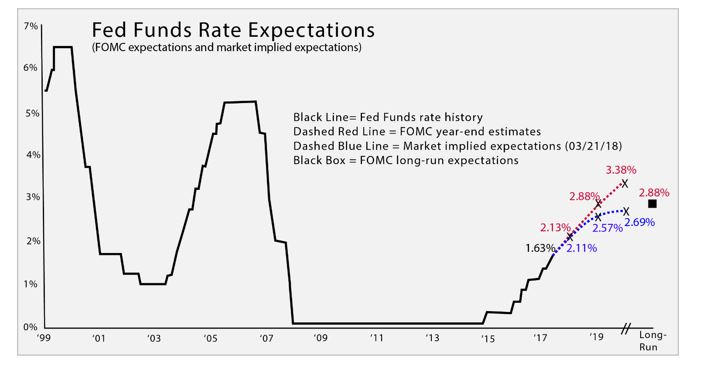
Adapted from a JP Morgan Asset Management chart.
Federal Reserve Balance Sheet Reduction:
As part of their QE (Quantitative Easing) after the 2008 crash, the Fed (and other central banks) purchased mortgage-backed bonds and medium-term Treasuries in the open market in large quantities.They became the Elephant in the room creating extra demand in the middle maturities of the yield curve to keep those prices up (and yields down).
Now they (and other central banks) are ceasing or reversing those practices creating QT (Quantitative Tightening) by no longer competing in the market to buy those types of bonds, and no longer reinvesting the proceeds of the maturities of the bonds they own. This policy reduces overall demand for mortgage bonds and medium-term Treasuries, which will cause prices to decline and medium-term rates to rise.
This is also related to our discussion of duration and bond prices.
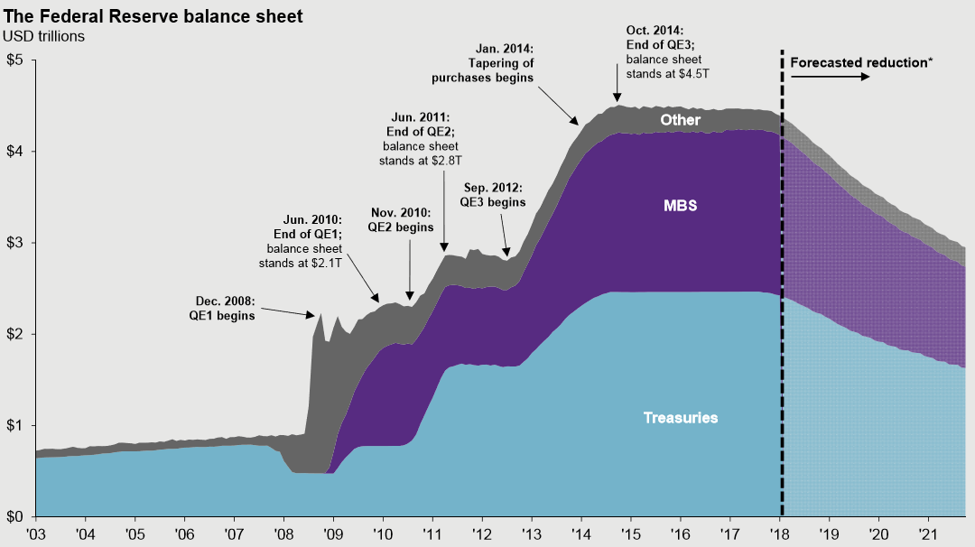
Chart from the JP Morgan 2018 Q2 Guide to the Markets.
At the same time that the Fed has ended its Treasuries buying program and will no longer reinvest the proceeds of maturing Treasury holdings, the Treasury Department will be issuing much more debt to fund the projected government deficit caused by lower taxes and higher spending.
Congressional Budget Office Federal Deficit (Treasury Issuance) Projections:
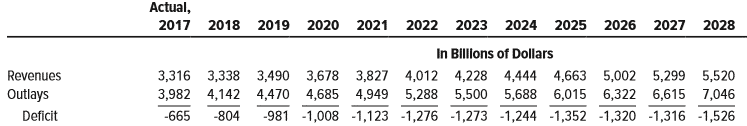
We are not asserting that the Congressional Budget Office (CBO) is a fountain of wisdom or a good fortune teller, but it would be unwise to ignore their calculations and projections.
They see Treasury rates rising to around 4% in 2019 to at least keep up with the Fed Funds rate as projected by the Federal Reserve Open Market Committee. To do otherwise would invert the yield curve (shorter-term rates above longer-term rates), which is a formula for recession.
There are those who predict recession (not bad for quality bonds, but bad for stocks) in the next couple of years – and a trade war could be a possible catalyst for that, but in the absence of a shock event, the CBO sees the 3-month Treasury yield remaining below the 10-year Treasury yield, which would not be a recession catalyst.
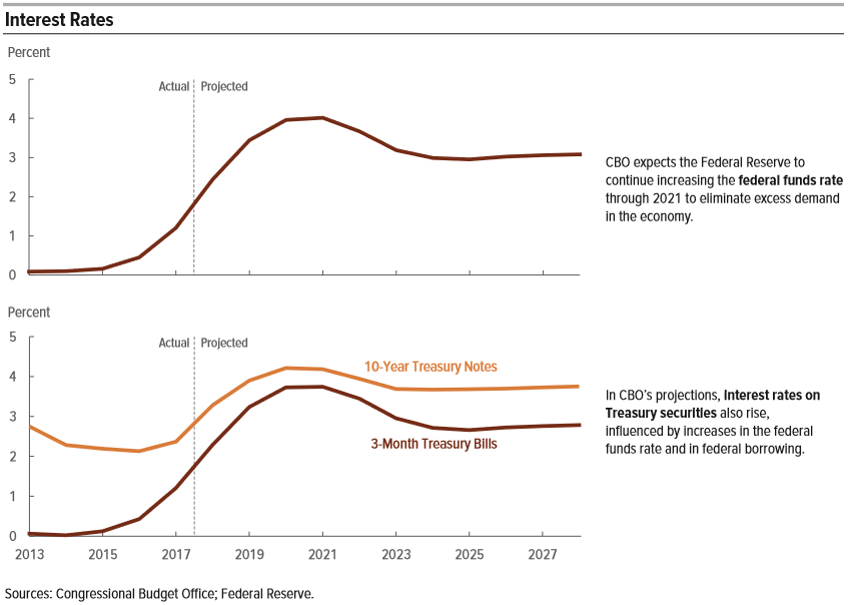
Combine the demand squelching effect of QT by the Fed and other central banks, with the substantial forward increase in the supply of Treasuries caused by the increase in the US Fiscal Deficit due to tax cuts and expenditure increases, and you have large Supply/Demand shift that is expected to increase interest rates in the middle of the curve.
Our is concern is the upward shift in interest rates will drive bond prices down offsetting interest yield.
Disclaimer: "QVM Invest”, “QVM Research” are service marks of QVM Group LLC. QVM Group LLC is a registered investment advisor.
Important Note: This report is for ...
more


Profit of bonds is a future of citizens of America!Income of other funds is the question.
Can you elaborate what you mean?