What, Me Worry?
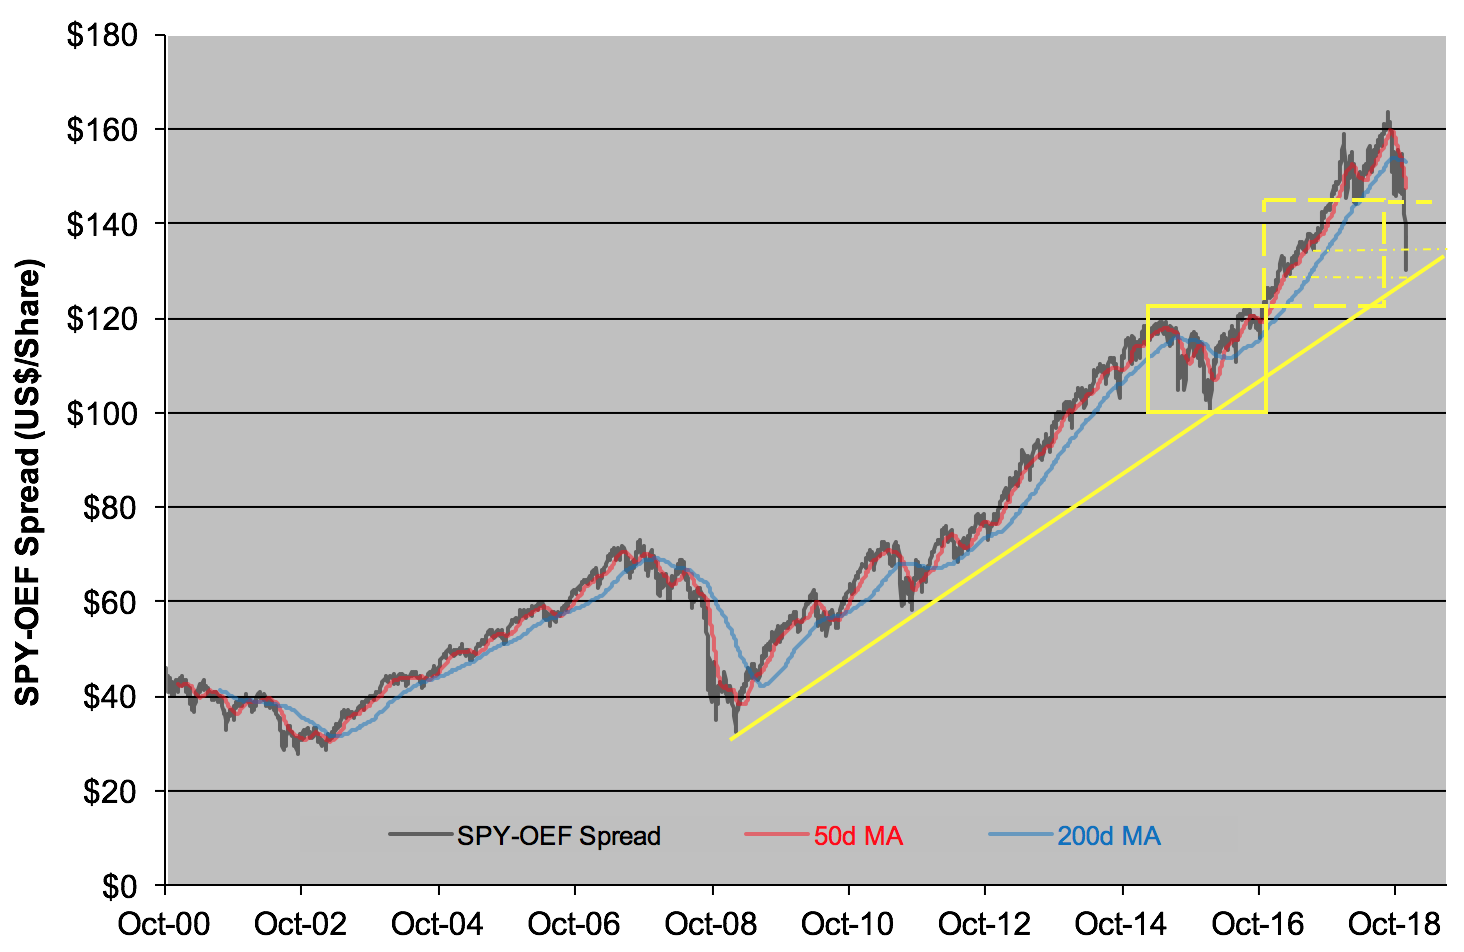
The precipitous plunge in stock prices over the past quarter has sent shivers down the spines of all but the steeliest of investors. Now, I don’t want to appear boastful, but I’ve been wearing a steel back brace during the panic selling. You see, I didn’t bail from equities during the tumble. Oh, there were surely moments of doubt as the ticker dropped by three-digit handles at a clip. I kept my resolve, though. Why? Because of the chart below:

This chart’s appeared in several Market’s Measure columns before, most recently in early December when a “death cross” made a grisly appearance and foretold of further weakness in the SPY-OEF spread.
Why should anyone care about the difference in the prices of the two ETFs? Because the spread’s been a remarkably good indicator of investor conviction. It’s a kind of a canary in the coal mine—perking up as confidence builds and swooning when the market’s oxygen dries up. The indicator’s been in an uptrend ever since it arose from the dismal morass of The Great Recession in 2009. You can see its support line scribed in yellow on the chart.
Clearly, that line’s been tested during the decade-long bull market—once back in the summer of 2011 and again at the start of 2016. And now, after the sugar high of the 2017 tax cut has worn off, we’re bouncing off the support line again. Below that, my steel back brace fails. If the line holds, then all this mishegas was just an exercise to wash out weak hands. An exercise made more scary, to be sure, by fumblings in Washington. Or Cabo San Lucas.
So, here’s the deal. By my way of thinking, we’ve got the makings for an additional 6 -7 percent rebound in the S&P 500 in the near term. That could take us to the 2,650 level. But if we weaken, if the canary dies and the SPY-OEF uptrend line is broken, then your (and my) defensive and hedge positions ought to kick in.
You DO have defensive and hedge strategies at the ready, don’t you? If not, there are some ideas here and here.
Disclosure: None.


