
What Is Robinhood?
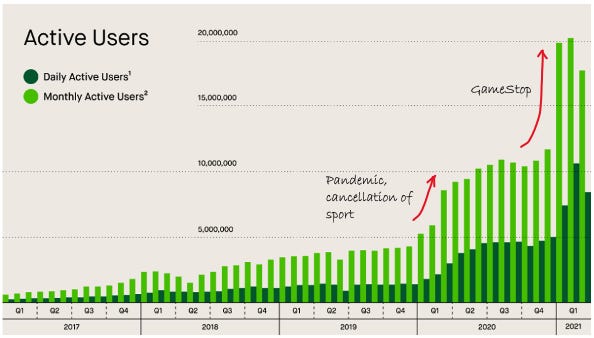
Last June, I wrote a piece in Net Interest called The Stock Market as Entertainment. It explored the explosion in retail trading activity happening at the time and suggested that one cause for renewed interest in the stock market was the cancellation of sport:

… a pivot from sports is a compelling explanation. The demographic of Robinhood’s customer base is similar to that of a sports bettor. Men aged 25-34 are the segment most likely to bet on sports on a regular basis. According to Deloitte 43% of North American men aged 25-34 who watch sports also bet on sports at least once per week, and that’s the same group that has flocked to Robinhood. The median age of a Robinhood customer has drifted up from 27 in 2017 to 31 now, and 80% of them are men.[1]
Indeed, Robinhood’s interface makes the transition between sports betting and trading seamless. The app has been compared to a mobile game (“Charles Schwab, meet Candy Crush,” according to an NBC News report) which users check ten times a day or more.
Robinhood customers also appear to be attracted to stocks for the same reasons they are attracted to sports events. In its S-1 prospectus DraftKings, a sports betting company, says that it delivers “betting experiences designed for the ‘skin-in-the-game’ sports fan – the fan who seeks a deeper connection to the sporting events that he or she already loves.” A look inside Robinhood portfolios reveals the sorts of companies that customers no doubt have deep connections to.[2]

One year on, it is clear that this explanation doesn’t suffice. Sport came back, but retail trading continued with enhanced vigor. Indeed, activity accelerated earlier this year, as Robinhood data attests.
|
|
Source: Robinhood S-1
An alternative explanation is one promoted by Balaji Srinivasan: “Everyone is an investor now.” He argues that everyone being an investor is the natural endgame of the financialization of the economy, just as the shift from farming to manufacturing was the endgame of its industrialization. “If in the 20th century, the 99% are labor and the 1% are capital, the flip happens this century where the 99% are capital and the 1% are labor.”

The idea is reflected in large white-on-green font towards the front of Robinhood’s S-1: “We are all investors.” Data from the Federal Reserve Survey of Consumer Finances shows US household direct ownership of stocks rising from the trough of 2013 and Robinhood reckons that will continue: “We believe democratizing finance for all is a one-way door, and these forces of change are more likely to accelerate than reverse.”
A Tavern on the Green
If there’s a synthesis between the two explanations, it lies in the conflation of gambling and investing. The two activities fall on the same spectrum and converge in the fuzzy area of financial speculation that sits between them. A few years ago, a group of researchers published a paper in the Journal of Behavioral Addictions looking at the relationship between gambling, investing, and speculation. Here’s how they frame the similarities and differences:
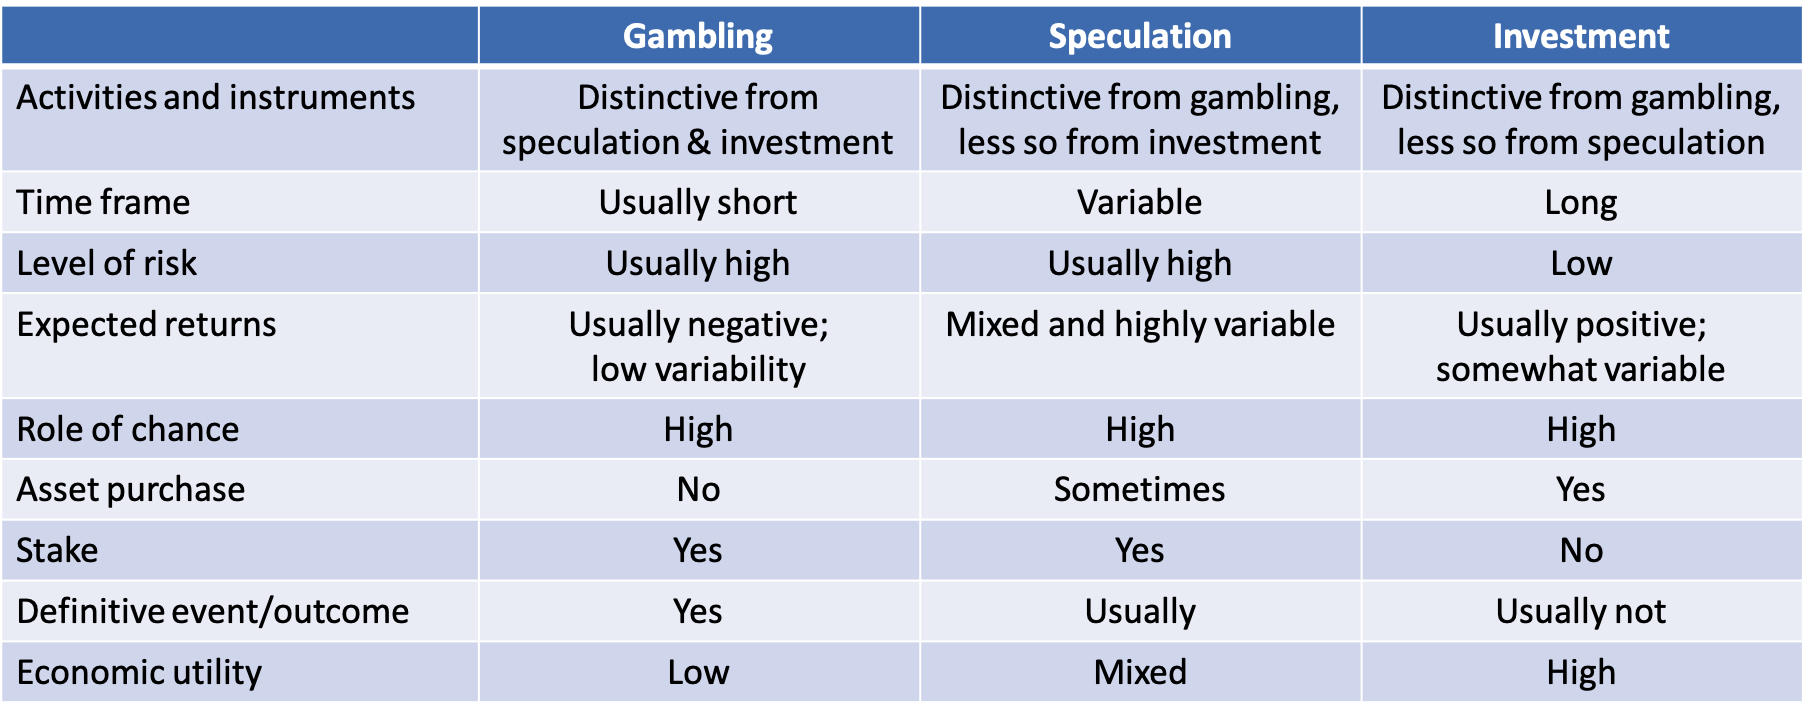 |
Conceptual similarities and differences between gambling, speculation and investment.
Ask any bystander of the industry what the fundamental difference between gambling and investing is and the response might be the role of skill versus luck in the outcome. But that wouldn’t be right. Many gamblers (for example Matthew Benham or Tony Bloom) show profound skill, and the role of luck in investing is well known. Rather, the key difference is that investing typically involves the creation or purchase of an asset with the expectation of long-term capital appreciation, which does not occur with gambling. In addition, in investing, the asset is never explicitly staked, whereas this always occurs with gambling – the best definition of gambling is staking money on an event having an uncertain outcome in the hope of winning additional money.[3]
Speculation captures the crossover of the two activities. Like investing, it takes place in a financial markets environment but it tends to be shorter term, higher risk and focused on generating gains from price movement with less regard for the fundamental value assets.
There’s a class of financial instruments that lend themselves very well to speculation and they are financial options. Their fixed expiration dates make them more short term than owning their underlying assets, the leverage they carry heightens their risk and the premium you pay upfront is equivalent to a gambling stake.
Which brings us back to Robinhood.
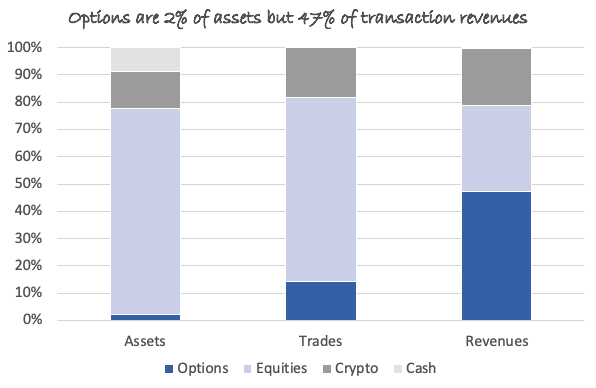
While Robinhood employs the investor narrative in its marketing efforts and claims “evidence that most of our customers are primarily buy-and-hold investors,” it makes the largest slice of its revenue from options. In 1Q21, it made $198 million of revenue from options, compared with $133 million from straight equities. Perhaps its options customers are subsidizing its equity customers, allowing them to buy-and-hold at cheaper rates than otherwise would be the case. But given how much money Robinhood makes from options, its incentives are less around promoting stock ownership and more around promoting options trading. In 1Q21, it made $2.9 revenue per options trade, which compares with $0.4 on an equities trade (and $1.0 on a crypto transaction). Customers had only 2% of their funds invested in options, yet options contributed 14% to total trades and 47% to transaction revenues.[4]
 |
Source: Robinhood S-1
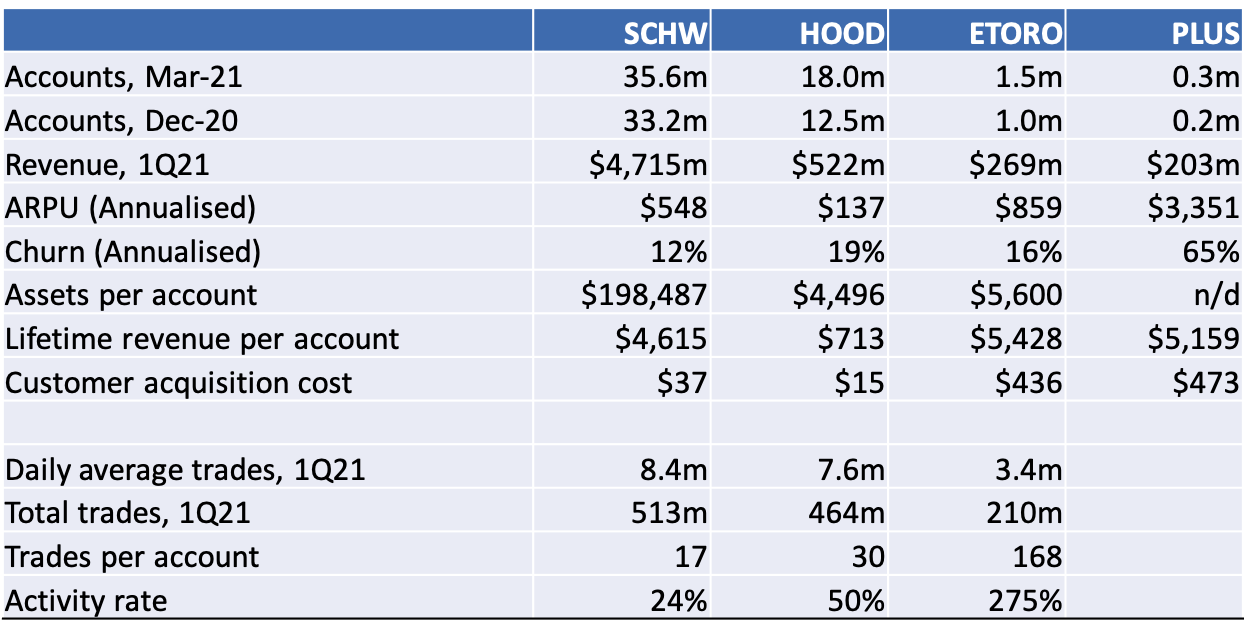
This set-up brings Robinhood closer to the contracts-for-difference (CFD) model popular in Europe. We discussed the model here in Net Interest back in March when we compared ETrade to eToro, just after eToro announced its intention to go public. CFDs are derivative instruments that allow traders to bet on the direction of an asset, either up or down. Unlike stocks, they don’t grant economic rights to the underlying asset. In some markets they bear tax advantages (for example in the UK, traders don’t have to pay stamp duty which they would be liable for on a stock purchase). As derivative instruments, they also embed leverage.
CFDs are a lot closer to gambling than to investing (hence the different tax treatment). Customers can lose all their money. eToro’s general risk disclosure states: “CFDs are complex instruments and come with a high risk of losing money rapidly due to leverage. 67% of retail investor accounts lose money when trading CFDs with this provider.” At Plus500, a competitor, the number is 72% – regulators insist on the disclosure.
So CFD platforms are in a constant hustle to acquire new customers to replace the churn. In 1Q21, Plus500 lost 16.2% of its customers over the quarter. They make up for it with high ARPU (average revenue per customer). In Plus500’s case, revenue was $838 per customer in the first quarter ($3,351 annualized).[5]
What about Robinhood?
Riding Through The Glen
Compared with Plus500, Robinhood’s churn rate is a lot lower. It is a more diversified business, and although it makes the biggest slice of its revenues from options, we don’t know what proportion of customers trade them. In 1Q21, it lost 4.8% of its customers, which is not as high as the CFD platforms but it is higher than Charles Schwab, where churn was 3.0% in the same period. Its ARPU is also a lot lower than Plus500’s, at $34 in the quarter ($137 annualized).
In really simple terms, those churn and ARPU numbers mean that Robinhood can expect to extract around $714 of revenue per customer over their lifetime, which compares with Plus500 at $5,200. Fortunately for Robinhood, its customer acquisition costs are commensurately low, at $15 in 1Q21, and all the free publicity Robinhood got in the first quarter actually pushed them down (from $20 in 2020).[6]
The analysis really is very simple though, because it assumes customers who stick around generate the same revenue contribution year-in, year-out. Robinhood expects that revenues from those customers may actually increase, and presents some impressive looking cohort charts to prove it. It’s true that as their assets appreciate, these customers will trade in bigger size, leading to higher revenues for Robinhood. The company estimates that as of the end of March 2021, its customers had seen appreciation of their assets of approximately $25 billion. Assuming this doesn’t include churned customers and only those currently active, it implies a 45% return on $56 billion of invested funds (given customers are currently sitting on $81 billion worth of assets).
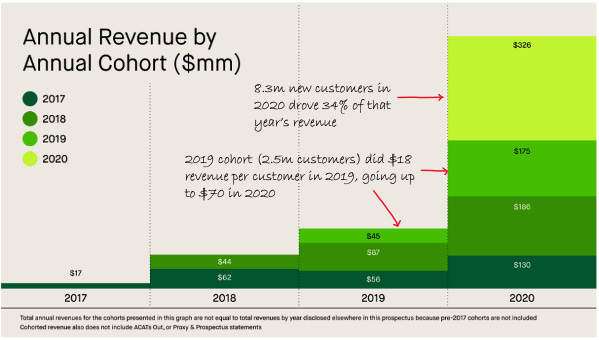 |
Source: Robinhood S-1
The problem with this approach is that markets don’t always go up. As Robinhood’s UK risk warning declares, “Past performance is not a useful guide to future returns, which are not guaranteed. Your investments may go down in value.” And more importantly for Robinhood, transaction turnover may not always go up whatever markets do. In fact, Robinhood is IPOing off an extremely high turnover base. (Editor's note: Upon completion of a successful IPO it will trade under the symbol HOOD.) In 1Q21, its customers did an average of 30 trades each or 122 on an annualized basis, up from 84 last year and 54 the year before. That’s not as many as eToro (FTCV), but it’s roughly twice the rate at Schwab.
Sustaining that level of turnover will be quite a feat, which is why cohort economics make more sense for a steady subscription based business than they do for a cyclical transaction based one.
 |
Source: Robinhood S-1 and company reports
To frame just how unusual this current period is, take a look at the chart below which shows the average number of trades per quarter executed by customers of Charles Schwab going back twenty years.
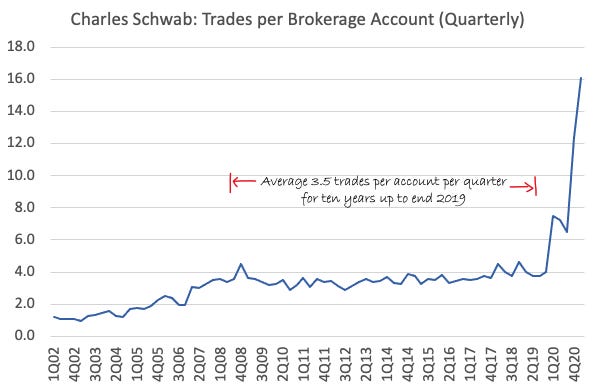 |
Source: company reports
And with Schwab data, we can even zoom right in to the present day by looking at weekly trends. Brokerage activity peaked around the time of the Gamestop (GME) episode at the end of January and has been on the decline since.
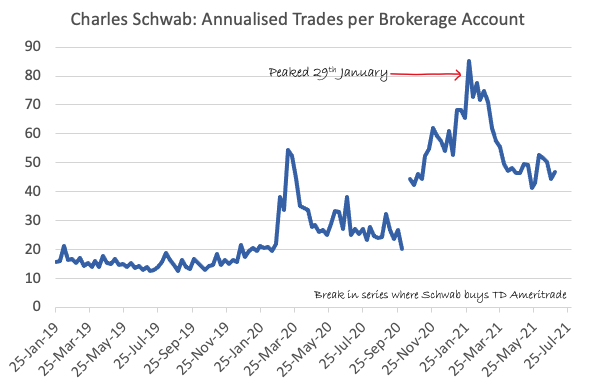 |
Source: company reports
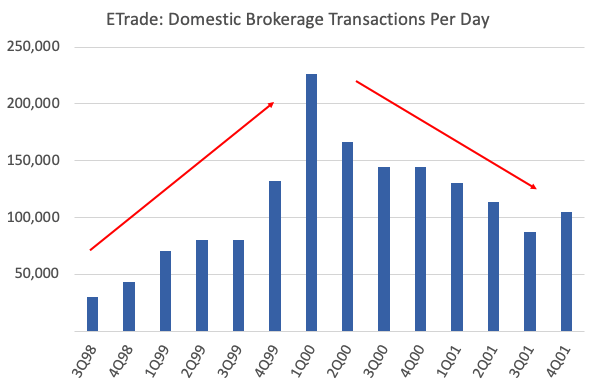
Finally, it’s worth looking back twenty years to see what happened after the last frenzy in retail trading activity in 2000. The chart below shows ETrade’s (ETFC) average daily trading volumes during the period (this one is not shown per customer, it’s across the entire ETrade customer base). After the peak in 1Q00, activity rates halved over the next eight quarters. It took a while to realize it, of course. On a conference call in March 2001, Charles Schwab, the man, talking about the performance of Charles Schwab (SCHW), the company, admitted, “We’ve come through a highly speculative technology bubble. Maybe I should have been more emphatic about understanding that this was a temporary phenomenon.”
|
|
Perhaps we are all investors now – or speculators at any rate, doing 120 trades a year and checking our app ten days a day – but let’s not forget, “it’s a bull market, you know.” Robinhood customers are sitting on $25 billion of gains ($1,400 per account) and that ‘house money’ may sustain activity for some time. But when it’s gone, trading may lose its allure and Robinhood’s growth will have peaked.
[1] In its S-1, Robinhood provides an update of these demographics. The median age of customers is still 31, but “we continue to welcome an increasing proportion of women to our platform, having tripled the number of women on our platform at the end of 2020 as compared to 2019.” This would put the proportion of women in the customer base at around 23%.
[2] As of August 2020, Robinhood shut down the API that was used by Robintrack to collect data of stocks held in Robinhood portfolios.
[3] Another notable difference lies in the variability of returns. Commercial gambling has a precise and mathematically determined negative return, whereas the magnitude and direction of monthly or quarterly changes in financial markets are much more variable and uncertain.
[4] I’ve assumed 61 trading days in 1Q21 to calculate these numbers, which is right for options and equities, but crypto trades 24/7 in which case the revenue per transaction there is closer to $0.7.
[5] Plus500 disclosure puts ARPU at $753 for the quarter, but that is based on end of period accounts; I’ve used average accounts over the period.
[6] The calculation here is ARPU divided by churn. It gives the perpetual value of a fixed revenue stream assuming a given level of churn.
Disclaimer: Marc Rubinstein has over 25 years experience as an analyst and investor in the financials sector which he distills into a free weekly newsletter, more


