

Image Source: Pixabay
The 10-year U.S. Treasury note has a problem. It’s bearing the weight of fiscal expansion, costly tax incentive plans, geopolitical divergence, and foreign repositioning.
Gold is reading the signals clearly. This week, the 10-year Treasury yield climbed to 4.51%, which marks its highest level since February.
The move wasn’t driven by a single catalyst but instead by a stack of stressors: the White House floated new 50% tariffs on EU imports, Moody’s issued fresh downgrades of regional U.S. banks, and the U.S. House of Representatives advanced a budget proposal through Congress that was loaded with long-term debt expansion.
The bond market absorbed that all at once and responded decisively. This matters to the 10-year yield – but now another story is emerging that we should all pay attention to.
What the Yield Moves Mean
The 10-year Treasury isn’t just a government I-O-U. It serves as a reference point for the price of capital around the world.
Mortgage rates, municipal financing, corporate bonds, and infrastructure loans all track or observe the 10-year. When that rate moves, it reverberates across markets, influencing valuations, credit access, and risk tolerance.
Some of the smartest investors on Wall Street follow this very closely. That’s because even a modest rise in the 10-year yield can add hundreds of billions in borrowing costs system-wide.
Year-to-date, as of late May, the 10-year yield hovers between 4.16% and 4.60%. That’s well above its 2022 level when the Federal Reserve began tightening (as it stood at 2.2%) and far above the 0.6% lows of 2020. Even though the Fed started cutting short-term rates again by 100 basis points in 2024, the long end isn’t coming down.
That signals markets aren’t convinced inflation is under control – or that deficit spending is. You see, historically, the 10-year has served as a kind of trust gauge.
In 2009, during the global financial crisis, it dropped below 2.5% as investors piled into safe-haven assets. In 2023, it briefly broke 5%, its highest level since 2007, amidst inflation pressures and debt issuance fears.
Today’s range reflects a mix of structural fiscal strain and skepticism that rate cuts alone can relieve it.
Who’s Holding the Risk
The Federal Reserve currently holds an estimated $700-$750 billion in 10-year notes, based on its long-standing quantitative easing (QE) policy and prior concentration of purchases of 10-year notes. That’s part of a broader $4.2 trillion Treasury portfolio. Its full balance sheet totals about $6.6 trillion, including $2.2 trillion in mortgage-backed securities.
That footprint shaped the curve for years. But now, as those holdings roll off and quantitative tightening continues, private buyers are left to absorb the flow. That means the market is still functioning but with less slack and external demand.
The absence of a built-in Fed backstop, or current QE policy, raises the cost of policy uncertainty.
Roughly $5.1 trillion in 10-year notes are outstanding. That number’s only going up. The U.S. Treasury is issuing heavily to fund expanding deficits. And while domestic buyers – banks, pensions, mutual funds – are stepping in, foreign demand has measurably weakened.
China, in particular, has been steadily reducing its overall Treasury holdings. It just dropped to third place in terms of foreign holders of U.S. debt, part of a broader retreat by foreign central bank buyers. That changes the mechanics of the market. Higher issuance with softer global demand pushes yields higher.
And we’re not talking small numbers. Over $17 trillion in financial instruments are directly influenced by the 10-year yield – either through pricing benchmarks or duration exposure. That includes:
- About $12.8 trillion in U.S. mortgage debt is closely linked to the 10-year, especially the 30-year fixed rate.
- $4+ trillion in long-term corporate and municipal bonds draws pricing and risk modeling from the long end of the Treasury curve.
When the 10-year rises, borrowing becomes more expensive. On Wall Street, that means mortgage rates climb and bond refinancing costs increase. But, over on Main Street, even small businesses – especially those relying on secured credit lines or fixed-term expansion loans – will face tighter terms.
That means the impact doesn’t stay on trading desks. It hits credit markets, operating budgets, and everyday financial decisions. This means that movements in the 10-year can impact whether people can afford to buy homes, whether cities can fund infrastructure development projects and whether companies, both large and small, can access capital to grow and innovate – or be forced to go under.
The 10-year isn’t just a policy signal. It’s the backbone of the borrowing environment.
The curve has returned to a normal upward slope. In other words, short-term yields are finally below long-term ones again – but not because markets expect strong growth. Instead, this relationship reflects strain, not strength.
Long yields are rising because the market absorbs more debt with less structural support. Foreign buyers have stepped back. The Fed isn’t buying. And issuance is accelerating. Markets are adjusting – not to growth, but to risk.
The Gold Signal Underneath
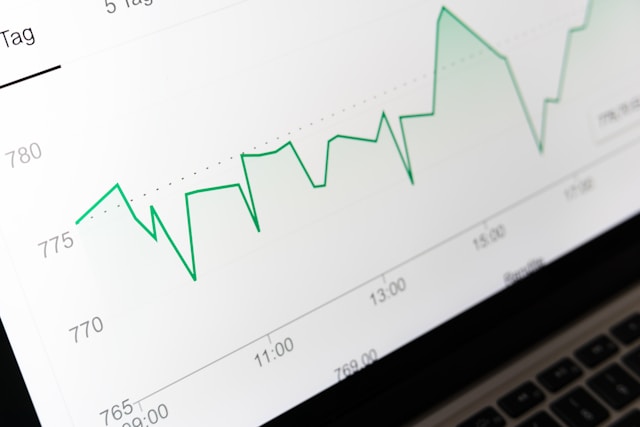
Meanwhile, the safer-safe haven, gold, was seen trading around $3,360/oz as of May 23, 2025, just below its all-time high, as you can see in the chart below.

(Click on image to enlarge)
Image Source: Bloomberg
That move doesn’t just reflect rate cut speculation or recession fear. It reflects pressure: a breakdown in confidence around fiscal direction, geopolitical alignment, and long-term capital flows. Gold moves without needing a specific policy signal. It reflects what’s already unfolding.
In 1790, Alexander Hamilton wrote that a national debt, if not excessive, could be a 'national blessing.' But even then, that blessing hinged on belief, on the conviction that debts could be serviced and that institutions could hold under their weight.
Hamilton saw debt as a tool. The 10-year is where the consequences of its misuse now show up. It no longer signals stability. It tracks fiscal overreach, geopolitical separation, and capital realignment.
Gold is the tell. It shows where conviction has already cracked – on the screen, in capital flows, and in the ways investors are positioning over the near and long-term. And as long as debt remains high and the 10-year remains stubborn, gold will attract that trust-related demand.
That’s why we continue to see a path toward gold reaching levels of $4,000 this year and $5,000 over 2026. In addition to those already in our model portfolio, we will be exploring even more gold miner opportunities in June that haven’t yet reflected this coming move. Stay tuned.
More By This Author:
Gold Held The Line: A Sign Of Underlying StrengthHere’s Why Rare Earths Are The Key To U.S. National Security In 2025
Powell’s Dilemma Reveals A Fed Stalemate

Comments
Log in or sign up to join the conversation.