
Weekly Technical Perspective On Crude Oil Prices (WTI)
In this series, we scale-back and take a look at the broader technical picture to gain a bit more perspective on where we are in trend. Crude oil turned from long-term uptrend resistance last month with price plummeting more than 10% off the yearly highs. Today’s decline is challenging the monthly opening range lows with the price now approaching broader slope support. Here are the key targets & invalidation levels that matter on the Crude Oil (WTI) weekly chart.
CRUDE OIL WEEKLY PRICE CHART (WTI)
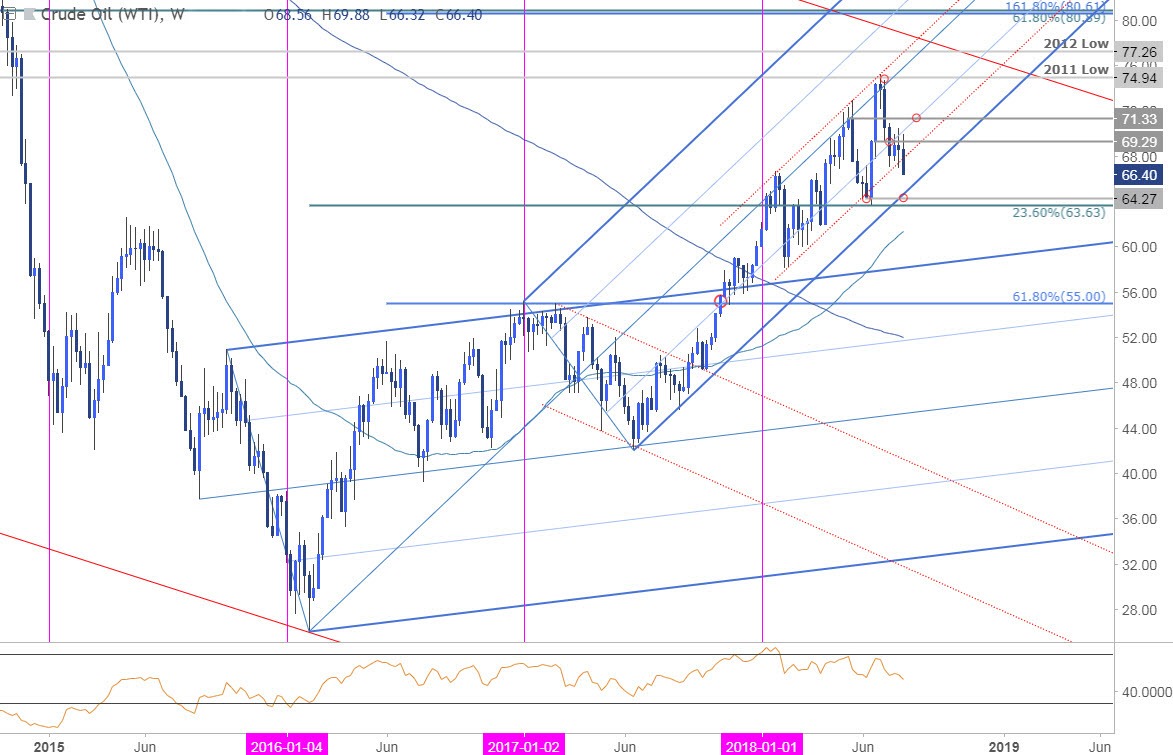
Notes: In last month’s Crude Oil Technical Perspective we highlighted a price reversal off confluence resistance at 75 on building momentum divergence while noting support targets at, “71.32 backed by the outside-weekly reversal close at 69.29- a break there would suggest a larger correction is underway targeting the sliding parallel (red) at ~66 and pitchfork support at 64.27- both levels of interest for possible exhaustion / long-entries IF reached.”
Price has now broken below parallel support (red) with downside weekly support targets unchanged at 66 and the June close-low/pitchfork support at 64.27. Resistance now back at 69.29 with bearish invalidation lowered to 71.33.
Bottom line: The risk remains weighted to the downside in Crude but the price is approaching levels of interest for support just lower. From a trading standpoint, I’d be reducing short-exposure heading into broader structural support – we’ll be on the lookout for possible exhaustion / long-entries on a dip lower into the aforementioned support zones. Intraday trading levels are largely unchanged but I’ll publish an updated Crude Oil scalp report once we get some further clarity on near-term price action.
CRUDE OIL TRADER SENTIMENT
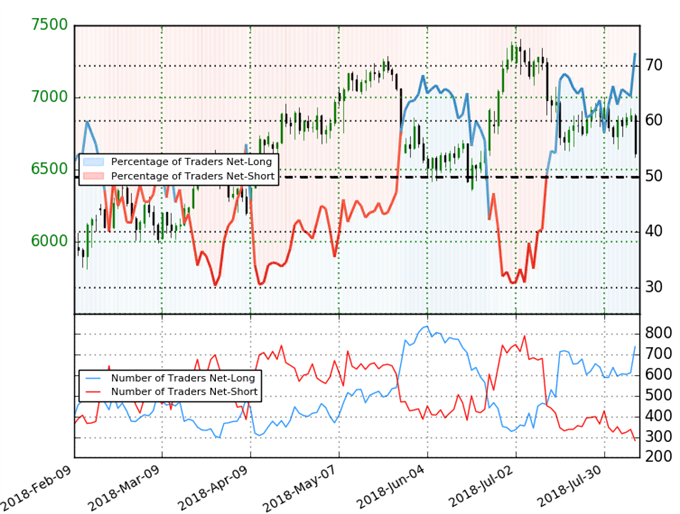
- A summary of IG Client Sentiment shows traders are net-long Crude Oil - the ratio stands at +1.94 (65.9% of traders are long) – bearish reading
- Traders have remained net-long since July 11th; price has moved 9.2% lower since then
- The percentage of traders net-long is now its highest since July 4th
- Long positions are3.4% lower than yesterday and 2.2% lower from last week
- Short positions are 3.9% lower than yesterday and 13.6% lower from last week
- We typically take a contrarian view to crowd sentiment, and the fact traders are net-long suggests Oil - US Crude prices may continue to fall. Traders are further net-long than yesterday and last week, and the combination of current positioning and recent changes gives us a stronger Crude Oil-bearish contrarian trading bias from a sentiment standpoint.
Disclosure: Do you want to see how retail traders are currently trading the US Dollar? Check out our IG Client Sentiment ...
more

