
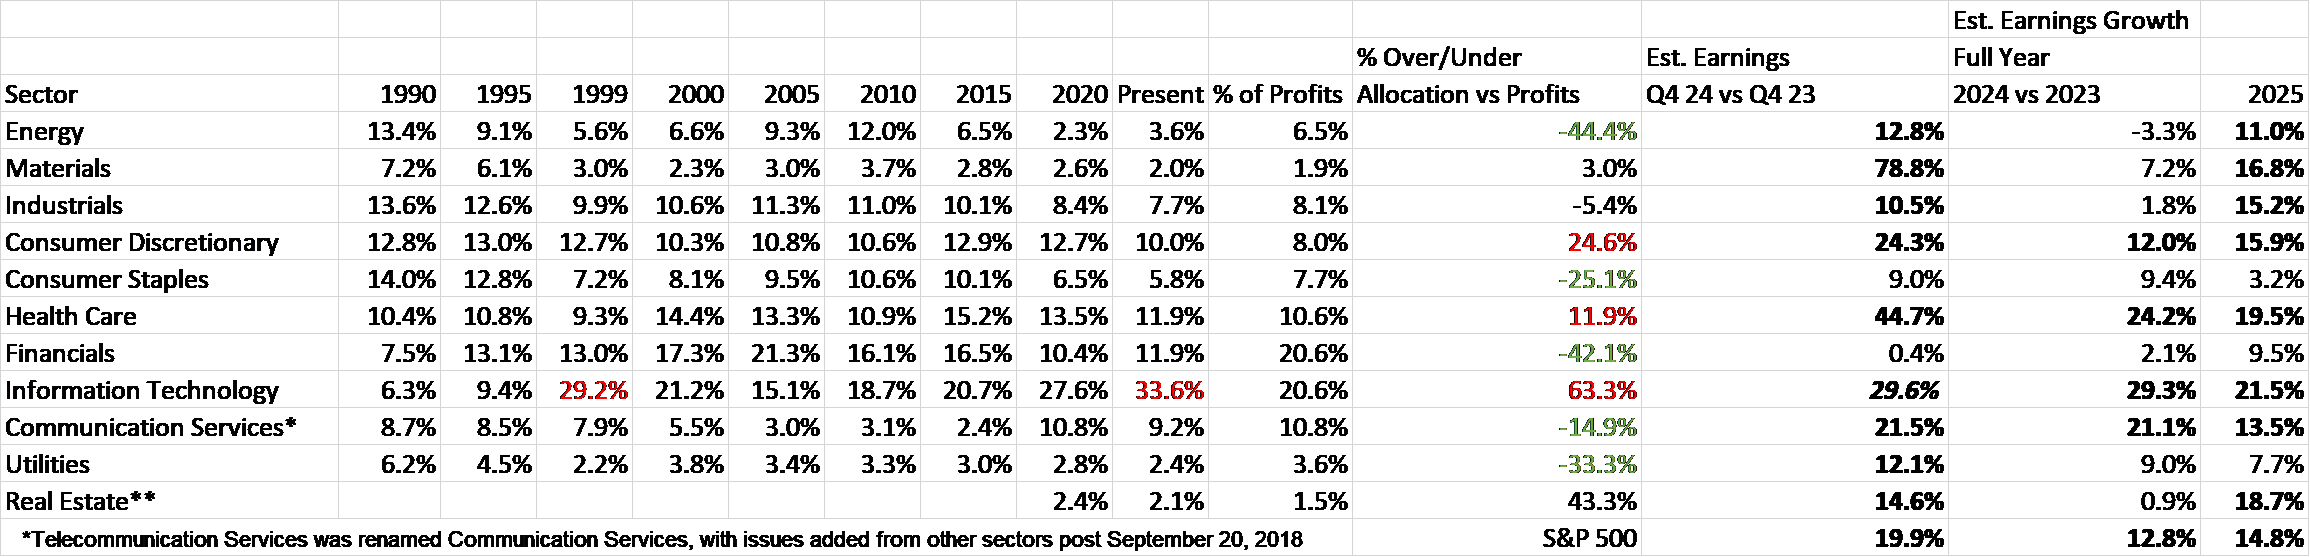
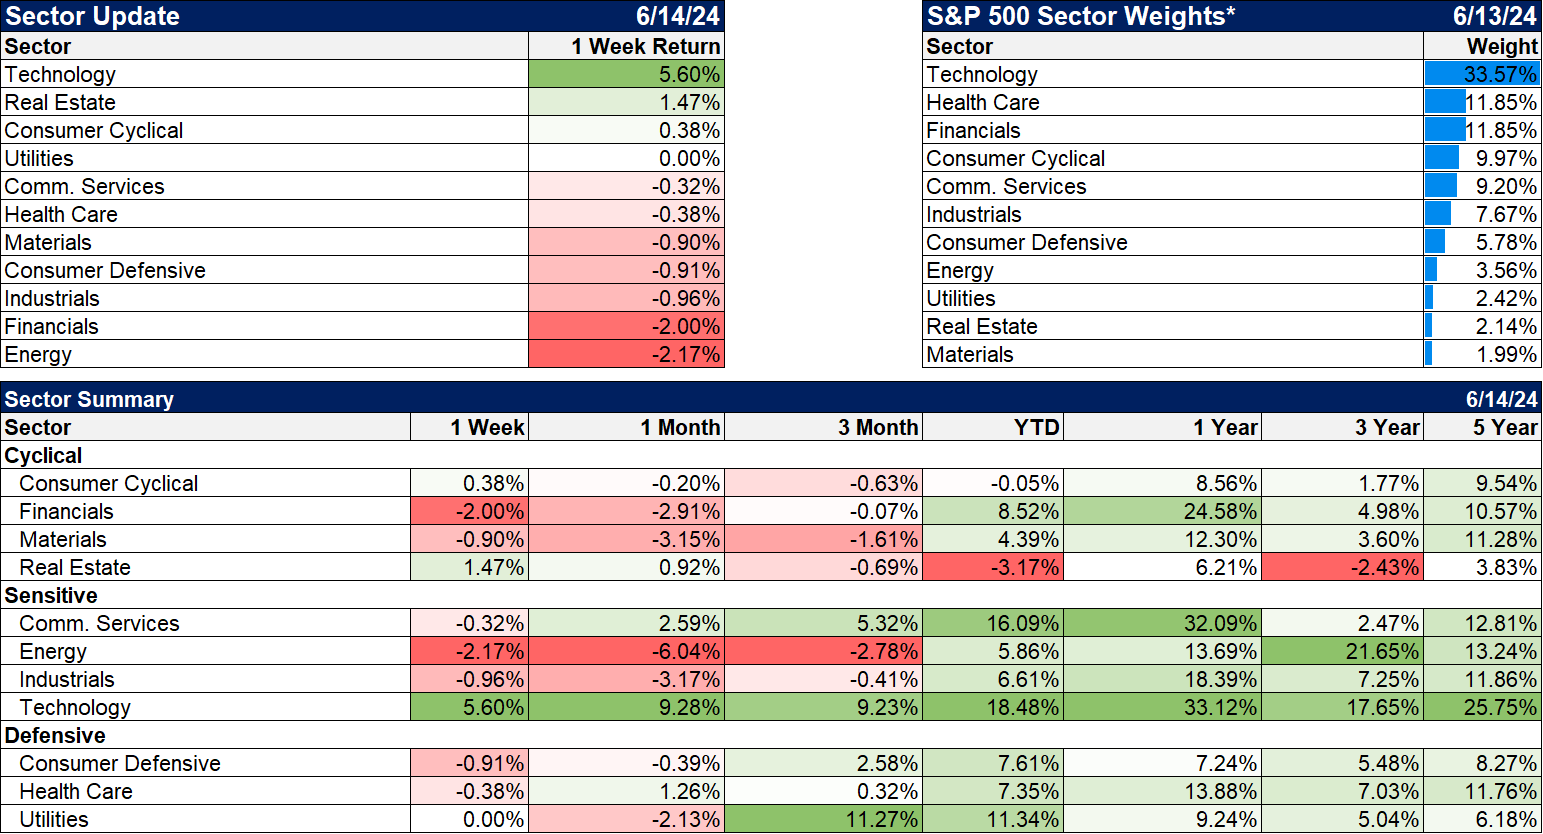
The S&P 500 reached a milestone recently. Or at least I think so. The technology sector, as of this week, is now 33.6% of the index. If you count the Communications sector as technology – and you should since 49% of the sector is Meta and Google – the allocation to technology oriented companies is 42.8%. The top 3 companies in the index account for 21% of the index, also a record. 6 of the top 7 stocks are technology – the only exception being Amazon which could be considered tech as well – and represent 32.9% of the index.

The top 10 now accounts for 36% of the index, the top 15 an astounding 42.25%. The index has 500 stocks but if you own it, nearly half your money is invested in just 15 stocks. I suppose one can call that diversified but it surely isn’t what most people think they are getting when they buy SPY.
At the end of 1999, at the peak of the dot com boom, technology rose to 29.2% of the index and that was matched at the end of 2021. I’m pretty sure the allocation rose in the first part of 2000 but I don’t have intra-year allocations back that far so I’m not sure if this is the all time high or not. It doesn’t really matter; the allocation to technology stocks is at an extreme, not just for technology, but for any sector. It can’t be justified based on the sector’s share of the S&P 500 profits; that would put it at 20.6% of the index. It can’t be justified based on its share of revenue; that would put it even lower to 11% of the index. You can come closest to justifying it by looking at estimated future earnings growth relative to the rest of the index. If you assume that 2024 technology sector earnings will rise nearly 30% – which is certainly possible – and that 2025 full year earnings for the sector rise another 21.5% – which is certainly possible – you can get the sector’s share of S&P 500 earnings all the way up to 24.7%. Assuming you think a proper allocation should be based on profit share – which certainly sounds reasonable – even with those heroic assumptions you can’t fully justify the current allocation. Of course, markets are forward looking so you’d think it would make a difference that tech sector earnings growth is expected to taper in the last half of the year while the rest of the index is expected to show better earnings growth. If anyone cares about that other than me it isn’t obvious from the market.
The sector allocation of the index changes over time as sectors come into and out of favor. There’s usually a good reason for the largest sector in the index to be the largest. When energy hit 28% of the index in 1980, oil had just peaked at nearly $40/barrel after being just $3.56/barrel in 1973. Unfortunately for energy investors that was the peak and with the dollar rising 65% over the next five years, crude oil fell to almost $10/barrel. Energy stocks were not the place to be in the 80s, with the sector falling to a 13% allocation by 1990. Even so, after hitting bottom in August of 1982, the market as a whole did quite well even as the energy sector fell in importance. It shouldn’t be forgotten though that stocks then had the tail wind of a large drop in interest rates, from 16% on the 10 year Treasury in 1981 to 7% in 1986. The gains in the market were driven by multiple expansion, not earnings growth – which was actually better in the 70s – and valuations started off very cheap. The Shiller P/E didn’t break decisively above 10 until the beginning of 1985. For reference the Shiller P/E today is 33, which is high but not dot com boom high when it hit 44. On the other hand, it has only been over 30 in the 1920s, the dot com era and a number of times since 2017.
There was also good reason for technology to rise from 6.3% of the index in 1990 to nearly 30% by 2000. The impact of the internet on the economy and our society is incalculable – in good and bad ways – and it was facilitated by the technology sector; to the victor go the spoils. There’s a limit to everything though and the tech sector crashed over the next few years, its allocation getting cut in half to less than 15% by 2002.
The financial sector boomed in the aftermath of the dot com bust, rising from a 13% allocation in 1999 to 22% in 2006. There wasn’t much of a recession after the dot com boom ended because the Fed cut rates rapidly and created a housing boom. Banks loaned to anyone who could fog a mirror and made, well, bank. The financial sector outperformed the broad market by 5 to 1 from 2000 to 2007. Then the music stopped and a lot of banks and brokers got caught still on the dance floor. From May 2007 to early March 2009, when the market finally bottomed, the financials fell almost 83% vs a still painful 52% for the S&P 500.
Some of the overallocation to technology today or any other leading sector in the past can be blamed on the methodology of the index and widespread use of indexing as an investment tactic. The S&P 500 is a capitalization weighted index, meaning the largest companies in the index get the greatest weight. What that means is that it acts kind of like a momentum fund, as the largest portion of new investments in the index flow to the largest companies and push them ever higher. But the biggest stocks have to get that way first so, obviously, someone who isn’t indexed has to buy these stocks to push up their valuations. We also see stocks fall down the rankings so, again, there are active buyers and sellers of individual equities at the margin. Tesla has fallen from the top 10 over the last couple of years because its stock has fallen by half. You can’t blame the current concentration of the index on passive investing alone.
With one sector so dominant, it is impossible to keep up with the performance of the index without closely mimicking it or taking it to an even greater extreme. You could buy the S&P 100 – the 100 largest of the S&P 500 – which has outperformed the S&P 500 18.3% to 14.6% YTD and over the last 1,3,5 and 10 years. Or you could buy the NASDAQ and put even more in the biggest stocks; QQQ has over 50% of the index in the top 10 names. But if you weight that handful of big stocks any differently you get a much worse result. The revenue weighted index is up 8% this year while the equal weight version is up just 4.2%. And you couldn’t do better by buying smaller because mid and small cap stocks have performed even worse. Value stocks, dividend growth stocks, high dividend stocks and international stocks have all underperformed the mighty S&P 500. The median return for the 503 stocks in the S&P 500 is just 3.8% YTD and the average is 5.3%. Only 121 stocks (24%) have performed better than the index as a whole; the last time so few stocks outperformed the index was in 1998 and 1999.
The question, of course, is whether any of this matters. I think it does because I think risk matters and a concentrated index is less diversified. I think it does because historically S&P 500 performance is much better when it is getting more concentrated than when it is getting less concentrated. If we’re already at a concentration extreme – and we are – it seems natural to be concerned about it ending. The last period of lessening concentration was from 2000 to 2012 when the return of the S&P 500 was a mere 1.6%/year. One could argue, I suppose, that isn’t fair since that period includes two big bear markets but the return is exactly the same if you just measure from 2000 to 2007. Can the index continue to get more concentrated? I suppose it can but it doesn’t seem like a good bet with the current concentration already at or near an all time high.
There are good reasons that the top 10 stocks have attracted so much attention. Most of them are great companies and deserve to be part of your portfolio. But do they deserve to be this big a part of your portfolio?
Environment

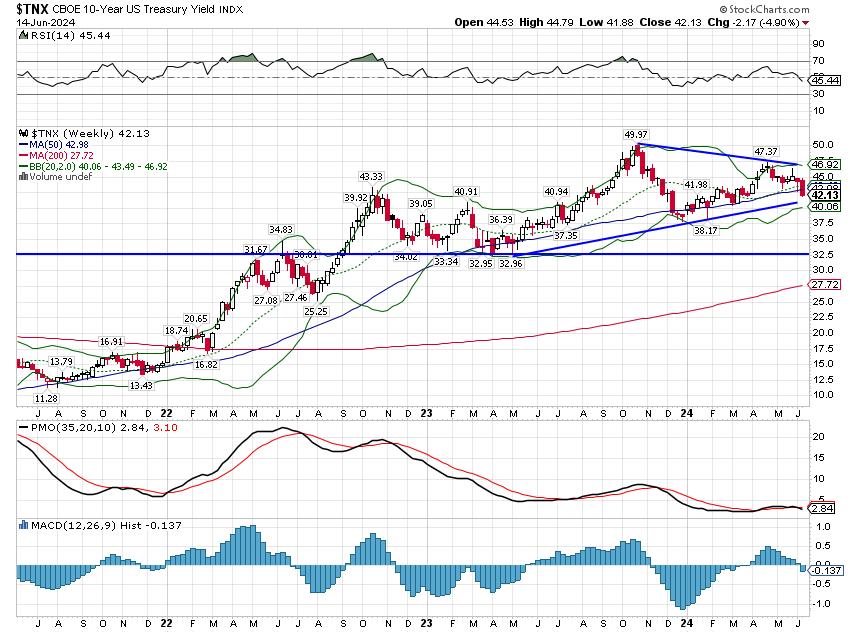
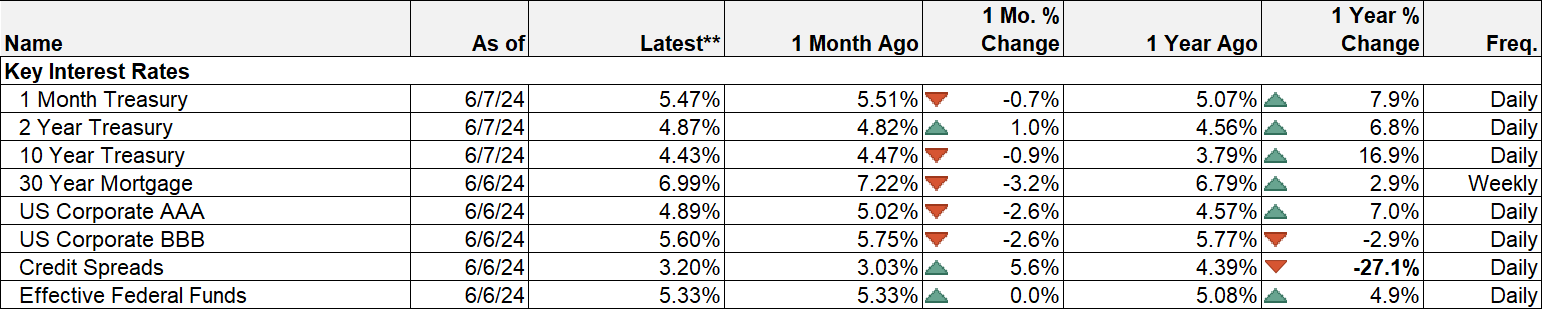
The spike in rates from the employment report last week didn’t last long. The 10 year yield fell 22 basis points last week and the 2 year fell 18 basis points. The 10 year yield is down over the last three months but the intermediate term trend is still neutral. The fall in rates, by the way, was driven mostly by a drop in inflation expectations. 10 year inflation breakevens fell 13 basis points on the week to 2.17%.
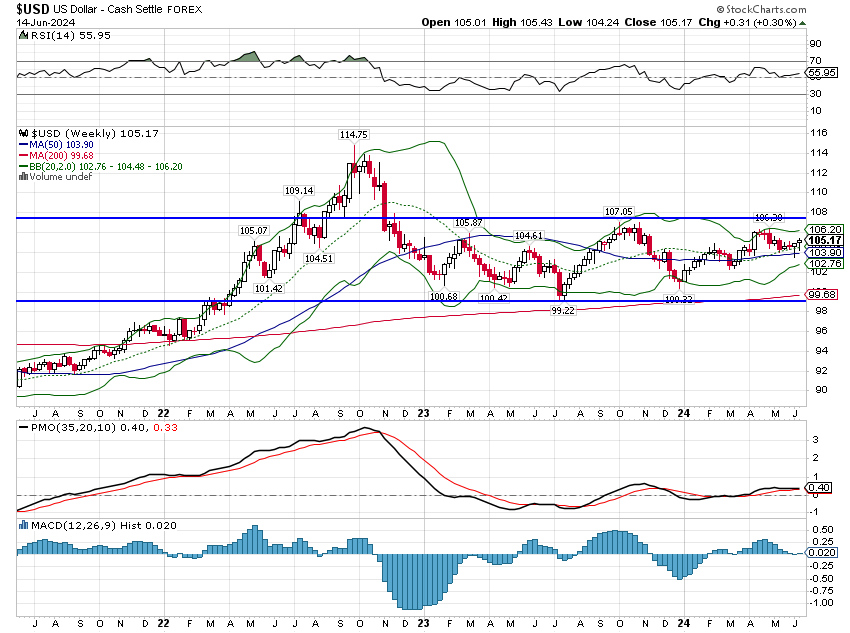
The dollar was up last week, mostly on the political turmoil in Europe (France). It wasn’t much of move though and no trends changed.
Markets
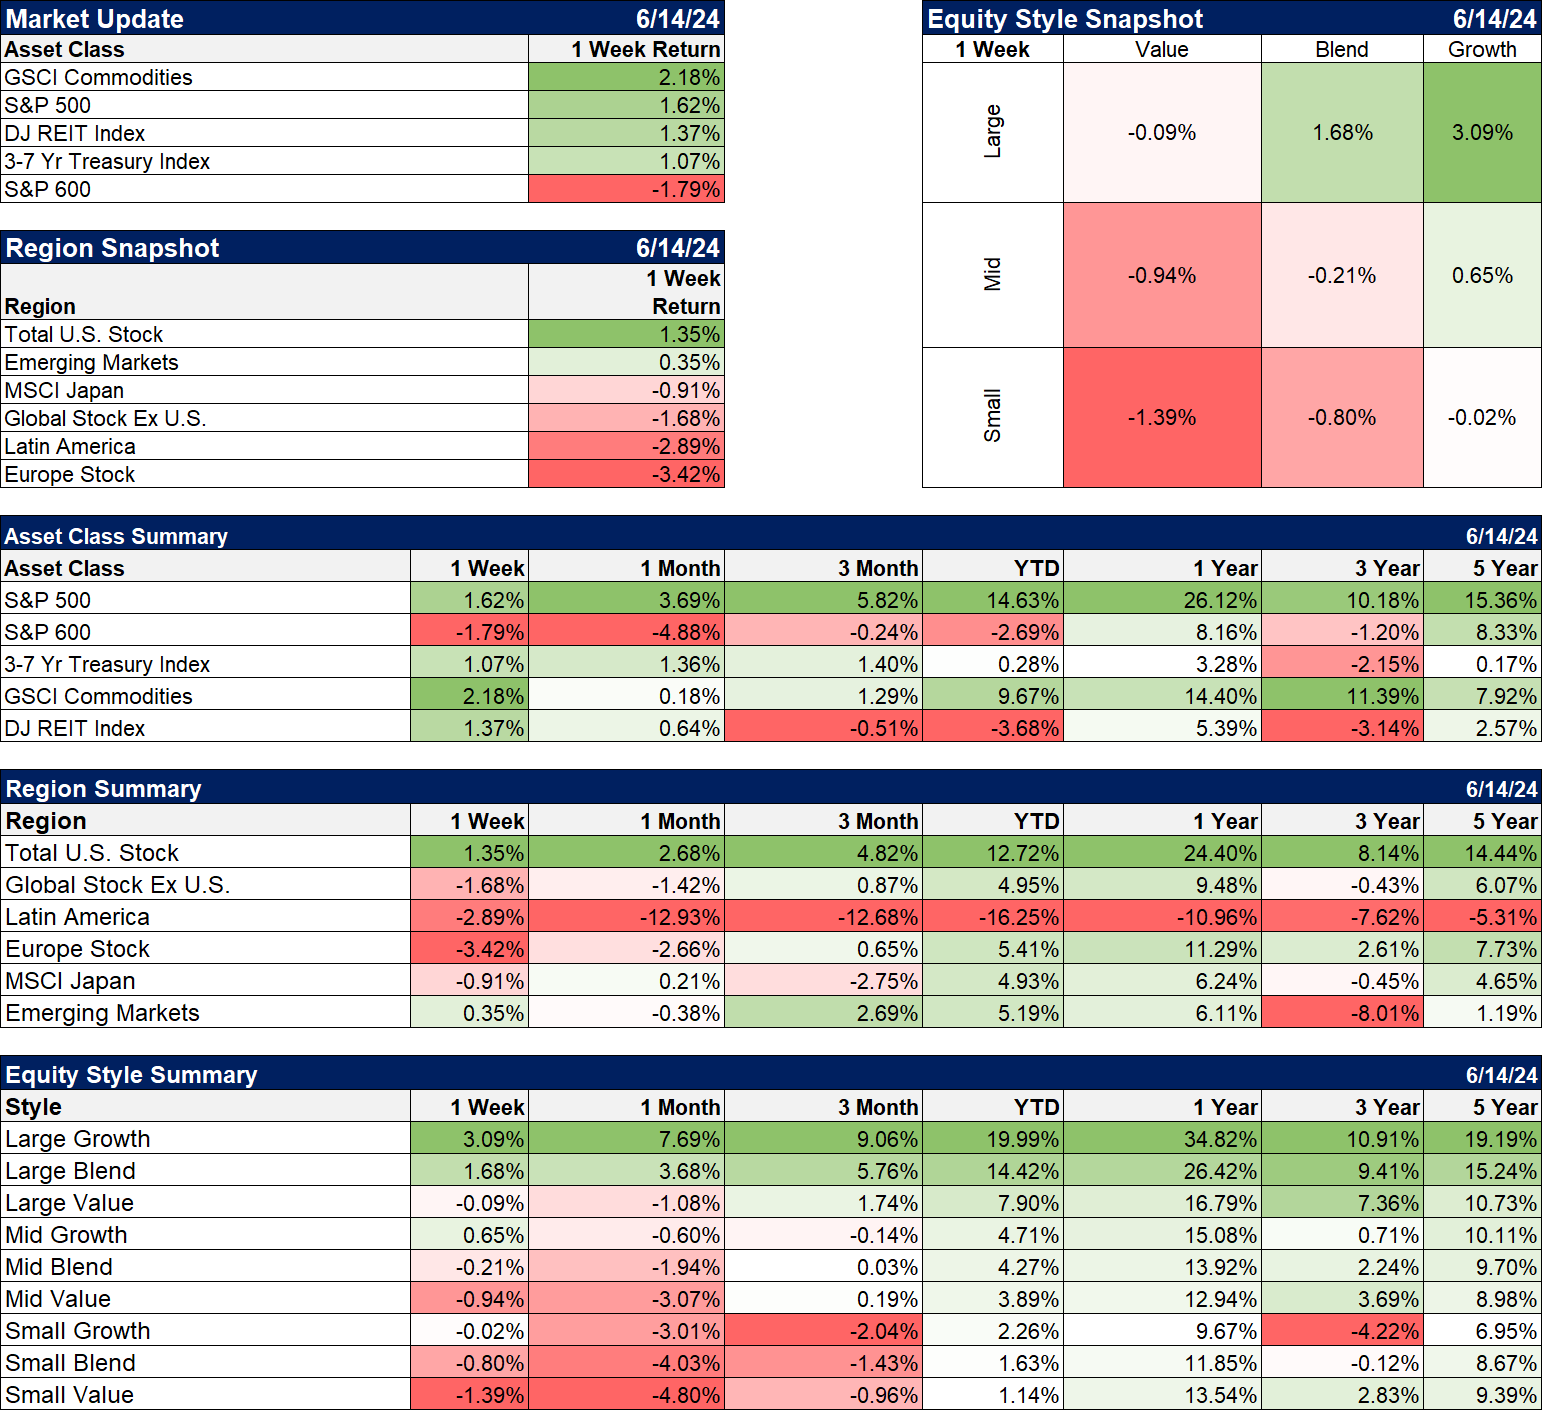
International stocks performed poorly last week as European stocks were hit from the turmoil in French politics. I don’t put a lot of emphasis on politics because the fear of political change is generally greater than the reality. This too shall pass. The usual suspects spent the week talking about how bad a rising dollar is for the rest of the world but a 0.3% move up in the DXY isn’t significant. There was also a lot of talk about the “end of the petrodollar” which doesn’t even deserve to be mentioned in polite company. Just so there’s no confusion about my stance on this fake “crisis”, it’s bovine waste.
All the other major asset classes were higher with the exception of small company stocks. Commodities led the way with crude oil up over 3% on the week; gold was also higher by 1%. REITs had a good week with falling interest rates and large cap growth stocks again outperformed, up over 3% on the week while value stocks were mostly flat. The three year performance now again favors growth over value. I don’t know when this will end but the underperformance of value stocks is reaching unprecedented depths.
Sectors
Just to prove that markets can be incredibly cruel, energy stocks were the worst performing sector last week even as crude oil led the commodity complex higher. Natural gas was down (-1.27%) but not enough to make a difference. The rally has become increasingly concentrated over the last 3 months with 5 of 11 sectors up. That is much worse than YTD with 9 of 11 sectors rising, although the largest gains are still in technology.
Market/Economic Indicators
Both the CPI and PPI inflation reports were better than expected on a month to month and year over year basis. The FOMC meeting was a non-event although the dots on the plot did change very slightly; the median expectation is now for one rate cut this year rather than two. That means absolutely nothing by the way; Fed members are among the worst forecasters around.
The only other economic news of note was the rise in initial jobless claims to 242k. That’s the highest since last summer when they hit 260k. Claims usually rise ahead of recession so the recently rising trend is of some concern but the level is not. Other than the COVID recession the last time we started a recession with claims under 300k was in the 1970 and 1973 recessions when the population was more than 125 million less than today.
Of note but not much was the drop in the University of Michigan consumer sentiment poll which fell to 65.6, the lowest reading since November last year. I don’t pay much attention to this survey because it is very political. It has been low for most of Biden’s term because Republicans have been consistently more gloomy than Democrats. What was noteworthy in this month’s poll is that the mood of Democrats soured. While it is tempting to blame that on fears that Trump will win in the fall, it isn’t reflected in the survey where current conditions fell more than expectations. Just one more bit of evidence that the economy has indeed slowed somewhat over the last couple of months.
This week’s reports:
Retail sales – expected to be flat overall and down 0.1% ex autos and gas
Industrial production – expected flat
Housing starts and building permits both expected to be slightly higher than last month
Philly Fed manufacturing index – expected to be positive but unchanged from last month
S&P Global US manufacturing, services and composite PMIs
Existing home sales – expected to be up slightly
More By This Author:
Friday Recap And DARP UpdateEmployment Gains Overstated
Question Time: Is the Stock Market Actually the Stock Market?


Comments
Log in or sign up to join the conversation.