
Weekly Market Outlook - Will Overhead Hurdles Constrain?
Weekly Market Outlook - Will Overhead Hurdles Constrain?
Despite Thursday's severe drubbing (the potential beginning of a bigger meltdown), stocks finished the week on a very bullish note, gaining more than 2.0% on Friday. That was enough to put the market back in the black for the week, even if just barely. The strong finish to last week, however, at least sets a bullish tone headed into the new trading week.
And yet, none of the key indices have cleared their major technical hurdles that have been in the way for the past month... give or take.
We'll look at the bullish and bearish arguments below, following a quick look last week and this week's key economic data.
Economic Data
Last week was loaded with economic news, but the highlight didn't arrive until Friday... November's employment report.
It was good. We saw net job-growth of 211,000 jobs. That wasn't enough to push the unemployment rate down below October's rate of 5.0%, but there are some that feel that particular unemployment rate figure reflects maximum possible employment.
Job-Growth and Unemployment Rate Chart
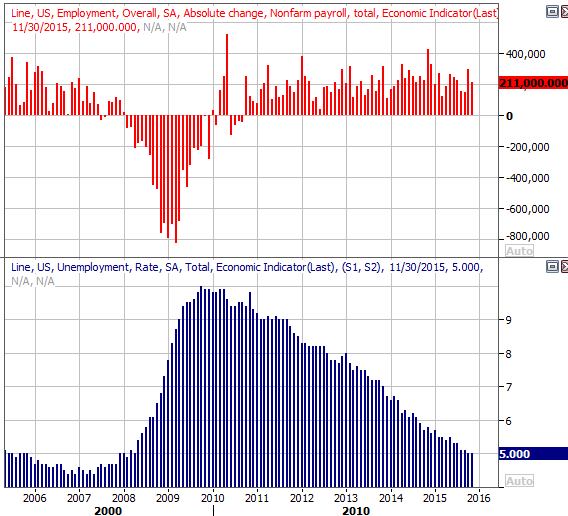
Source: Thomas Reuters
We also got updates on both of the business survey ISM indices.... the regular "manufacturing" one, and the services one. Both fell last month, and the ISM index broke below 50 -- reaching 48.7 -- suggestive of a recession.
ISM Index Charts
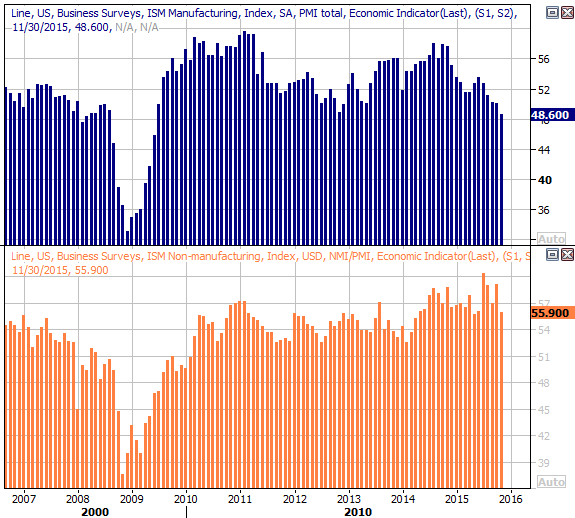
Source: Thomas Reuters
That one reading of 48.7 is not an official determination of a recession; it takes more than that to push the economy as a whole backwards. But, all recessions start out small.
All the other data is on the following grid:
Economic Calendar
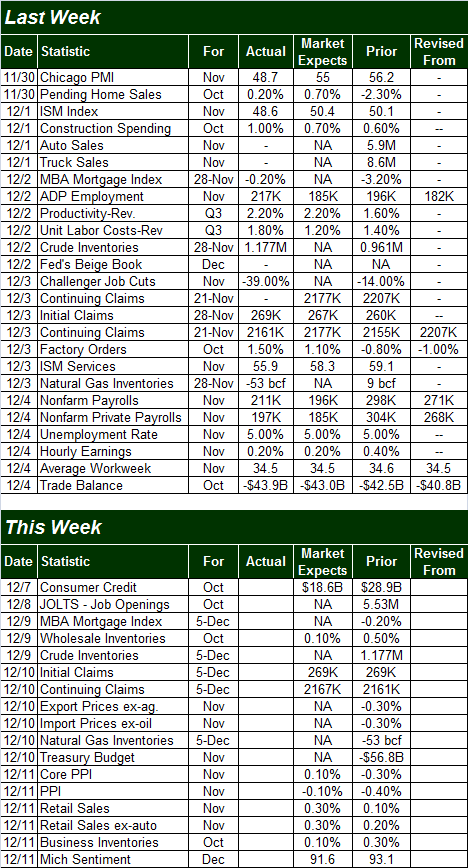
Source: Briefing.com
This week won't be quite as busy, but we'll be getting a couple of biggies on Friday... last month's retail salesand the producer price inflation rate, both for November.
Economists expect to see little change in the producer price inflation rate, with or without oil and food factored in. As a precursor to consumer inflation rates, this suggests the following week's data on that front will be equally tame.
Producer Price Inflation Chart

Source: Thomas Reuters
As for retail sales, economists are looking for a moderate 0.2% improvement, with or without cars. It's critical that retail consumption meets or exceeds those expectations. Though December is a bigger sales month due to holiday spending, November is a biggie too that the economy - and retailers in particular - need to go well as a sign of overreaching economic strength.
Retail Sales Chart
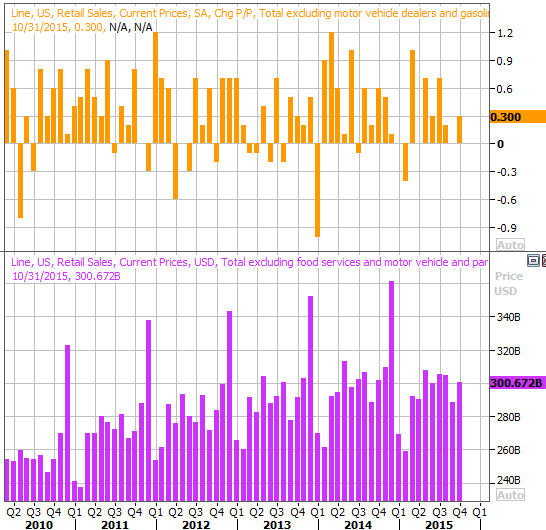
Source: Thomas Reuters
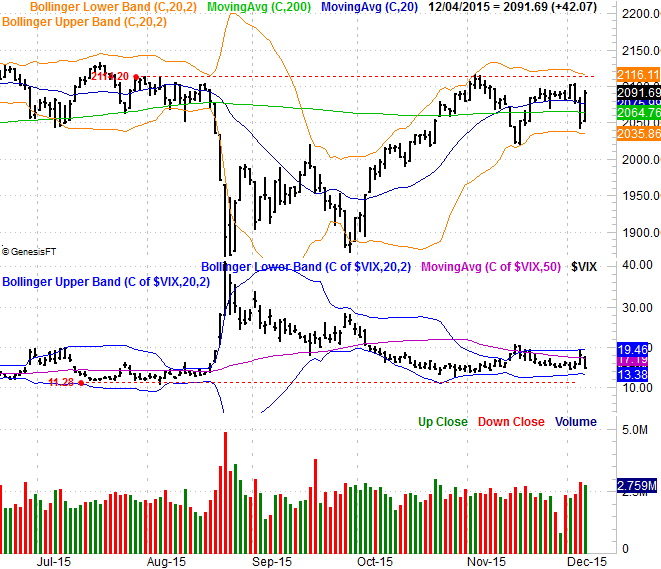
Stock Market Index Analysis
In some regards, Thursday's big stumble following the decision from the European Central Bank to lower rates may have been the best thing the bulls could have asked for. Already feeling a little overextended from the mid-November rally (and really, the rally that started in October), that pullback was the second sizeable pullback we've seen in less than a month, and may be enough to hit the market's "reset" button. Friday's huge bounce-back certainly lends itself to that idea.
On the other hand, the S&P 500 (SPX) (SPY) still has a big layer of resistance to deal with at 2116. That's where the upper Bollinger band currently lies, and where the index has topped out a couple of times since July. The index needs to clear that level to get really bullish again. The upside to that scenario is, there's more than a month's worth of consolidation under the market's belt right now. If the index clears 2116, it could have a solid slingshot effect, hurling the S&P 500 higher.
S&P 500 & VIX Daily Chart
Chart created with Trade Navigator
The challenge is the CBOE Volatility Index (VIX) (VXX). There's (probably) not a lot of room for it to move lower, though it will need to move lower if the market is to move meaningfully higher.
Ditto for the Nasdaq (COMP) (QQQ), and the Nasdaq Volatility Index (VXN) . That is, while Friday was impressive, it's not like the composite has actually cleared the big ceiling(s) around 5175. If those ceiling are cleared, though, look out above.
NASDAQ Composite & VXN Daily Chart

Chart created with Trade Navigator
For the record, the BigTrends TrendScore for stocks was 82.5 as of Friday. That's still in bullish territory, momentum-wise, even if the indices are facing resistance.
Zooming out to a weekly chart of the S&P 500 doesn't give us anything new, although it does give us a little more perspective of the market's current action... including the stagnation, and the fact that beyond 2116 there's another huge technical ceiling at 2132.
S&P 500 & VIX Weekly Chart
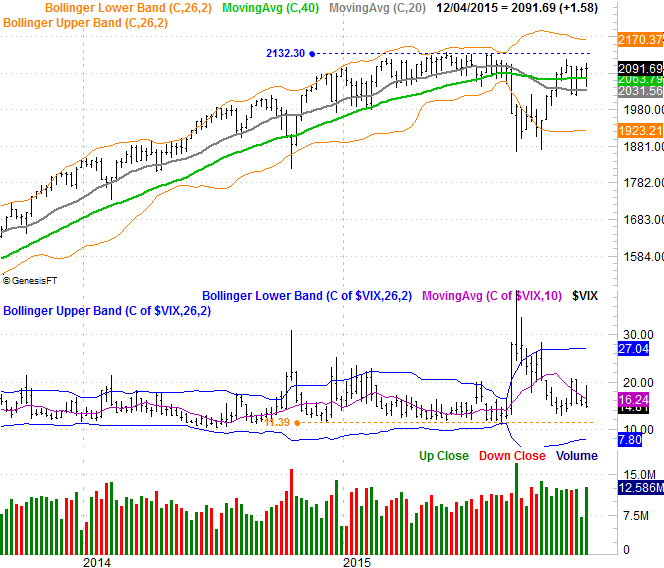
Chart created with Trade Navigator
Throwing a wrench in the works (and mostly working against the bulls) is the fact that the market's trailing P/E is now 19.9. That's pushing the limit for even the most optimistic and aggressive traders. Even more vexing is the fact that traders are likely counting on a Santa Claus rally later this month, which would likely require something of a pullback to set it up.
This week is going to be a tricky one. Don't respond too quickly to anything. The market's support and resistance lines are still intact, and need to be broken before the market is moving at a trade-worthy pace again.
Interest Rates
The interest rate debate moved back into the spotlight, with the ECB lowering its primary rate at the same time Janet Yellen all but assured it that the U.S. would see a rate hike this month.
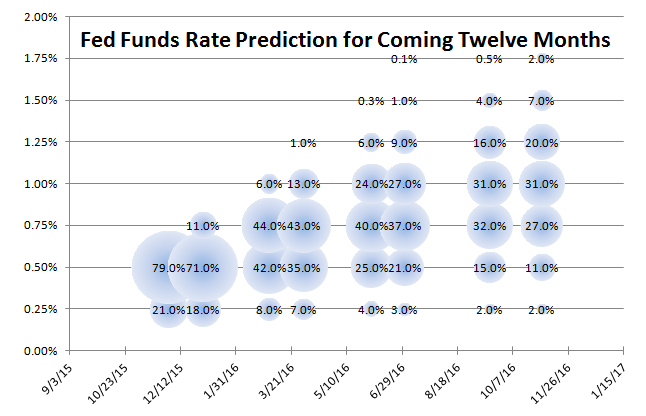
What's not been as discussed as much is what the interest rate environment outlook looks like. To that end, here are the rate-outlook odds through late next year.
Fed Funds Futures Chart
Data provided by CME Group
It looks more or less like the most recent update, but there's one subtle difference now... the odds now favor a Fed Funds rate of 1.0% by November of next year, versus the odds favoring only a 0.75% Fed Funds rate by that time just a month ago.
Disclosure: None.


