
Weekly Market Outlook - How Long A Pause?
Weekly Market Outlook - March 7th, 2016
Friday's finish was a lackluster one, possibly hinting that this leg of the rally has finally run out of gas and the bulls need a breather. Of course, after what was nearly a 10% runup from the mid-February low, a break for the bulls is neither surprising nor especially troubling just yet. The crux of the matter is when, where, and if any rest period for the rally comes to a close and the bullishness is rekindled.
We'll look at the line in the sand in a moment, right after a quick run-down of last week's and this week's economic data.
Economic Data
Last week's economic dance card was pretty full, but only a couple of items were of any real interest... the ISM data, and February's job report.
As for the ISM numbers, both were a little better than expected.The ISM manufacturing index ticked a little higher from 48.2 to 49.5 (versus an expectation of 49.0). But, still under the 50 threshold, it indicates a contraction. It's the second month in a row we've seen a slightly higher reading, however, so perhaps where at least pointed in the right direction.Another bad month or two from this data could become a problem.
The ISM services index, on the other hand - although falling for a while now - remains above the key 50 level, rolling in at 53.4 for last month.Even so, the readings for the last couple of months have been on the low end of the long-term range, and we could use a rebound soon.
ISM Index Chart
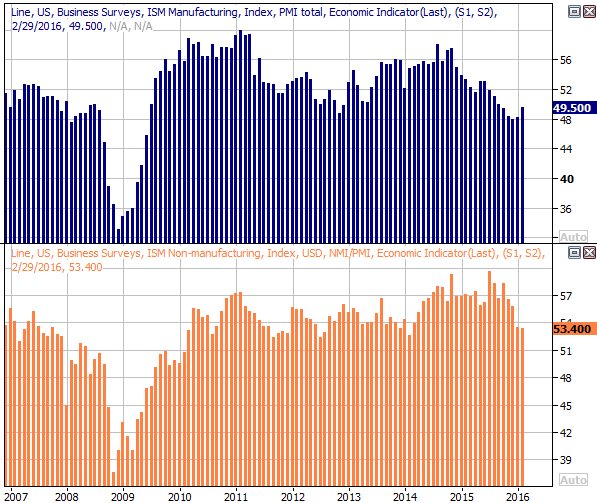
Source: Thomson Reuters
The U.S. economy added 242,000 new jobs last month. That was better than the expected 180,000, and more or less in line with the recent average. It wasn't enough, however, to push the unemployment rate any lower than its current reading of 4.9%. That's still nearing an absolute low possibility though.
Payroll Growth & Unemployment Chart
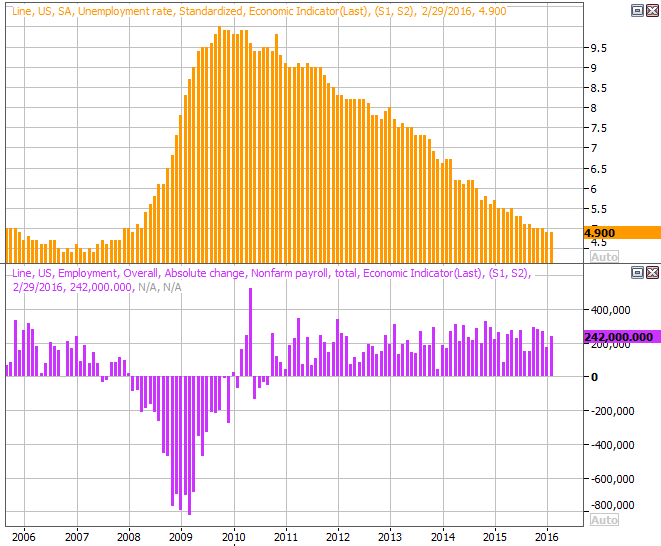
Source: Thomson Reuters
While the primary unemployment figures paint a modestly bullish picture, they don't tell the whole story... and the rest of the story is at least a little more encouraging.
We covered it in more detail late last week, but we can summarize the point again like this: The number of people with jobs hit a record high last month, the number of people without jobs hit a multi-year low last month, and the number of people who are not being counted as unemployed but still want the job anyway continues to trend lower.The percent of the U.S. population that currently has a job surged to a multi-year high reading of 59.8% in February, and the percentage of the population that's actually now in the labor force (working or unemployed) hit a multi-month high reading in February as well.
There are no other proverbial "shoes to drop" in terms of employment, other than perhaps the slight lack of wage growth. Even then, though, that can at least be partially explained by a lack of inflation.
All the other data is on the following grid:
Economic Calendar
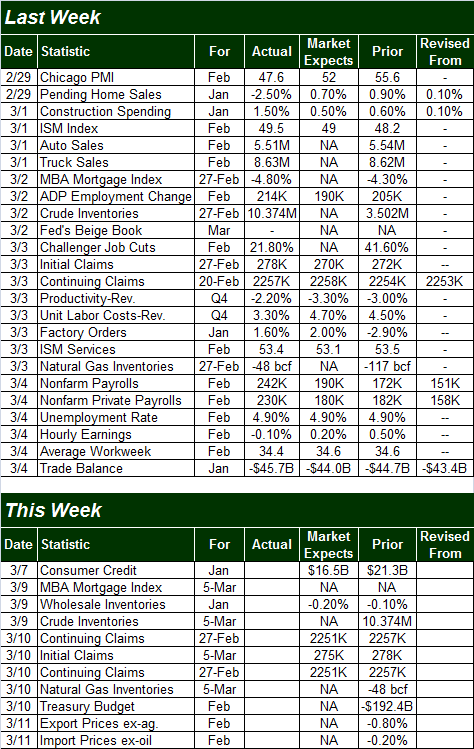
Source: Briefing.com
This week is going to be particularly quiet in terms of economic news; there's not even a preview chart worth showing.
Stock Market Index Analysis
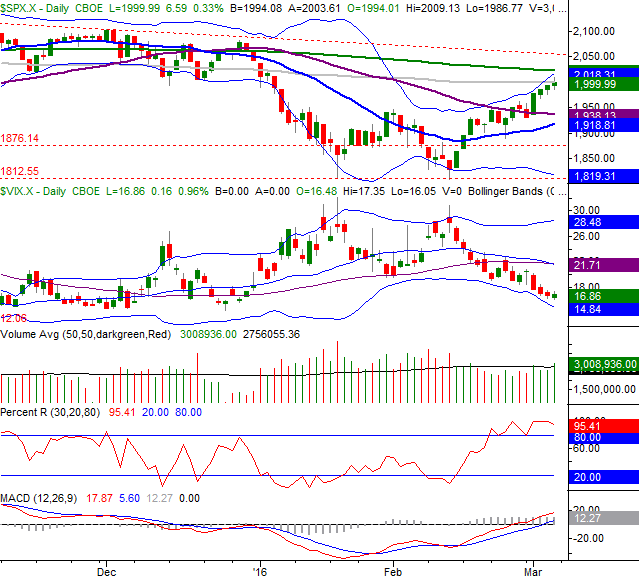
Though the market logged another gain last week, it didn't end last week on a particularly strong foot. Though the S&P 500 (SPX) (SPY) briefly traded above the 100-day moving average line at 2000 by hitting a high of 2009. When push came to shove though, the index gave up most of its intraday gain to close right at 2000. The end result is a doji bar (with an open and close both right at the middle of the bar). Generally speaking, when a doji bar takes shape after a prolonged rally, it means the market is trying to pivot into a countermove. Notice that the CBOE Volatility Index (VIX) (VXX) also made a doji-like bar of its own, adding to the likelihood at least a short-term reversal is in the cards.
S&P 500 & VIX Daily Chart
Chart created with TradeStation
It's too soon to make major bearish conclusions. The rally since the February 11th rebound has been big, and stocks deserve a breather. It's just a question of how much of a breather the S&P 500 and the other indices need now.
The 1928 area is the most plausible floor right now, should a pullback take hold. That's where the 20-day and 50-day moving average lines should converge soon. Until that level fails as support, the bulls have the edge. After all, the MACD lines are still pointed upward.
The market still isn't over the big hurdle, even if any pullback is short-lived. The line in the sand to watch is the 200-day moving average line, currently at 2023. Until that happens, things could still go either way. And remember, we'd still want to see a confirmation of that uptrend/breakout with a Percent R line confirmation signal; we'll talk more about that when and if the time comes.
Zooming out to a weekly chart of the S&P 500 doesn't tell us anything brand new, but it does give us some more perspective on where things are now. The reversal effort that took shape four weeks ago with a long-tailed "dragonfly" doji has been almost textbook-perfect, hurling the market higher in a hurry. And, we can also see that rebound took shape when the index found the floor of a major long-term trading range.
S&P 500 & VIX Weekly Chart
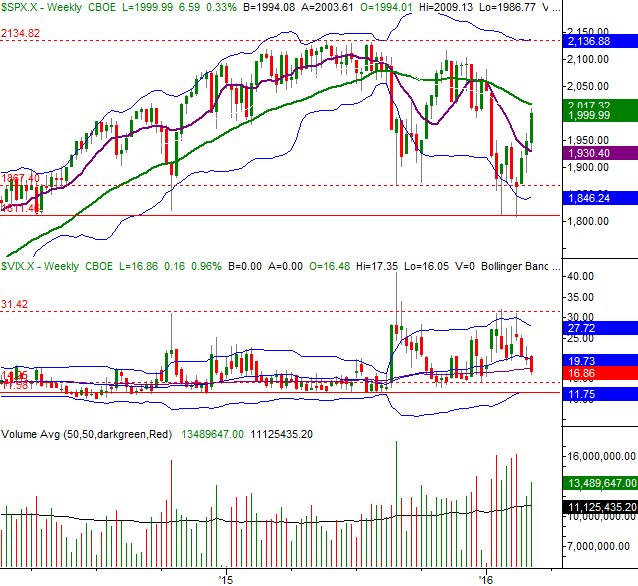
Chart created with TradeStation
The weekly chart also indicates the VIX still has room to keep edging lower until it hits a major floor, providing a more serious headwind for stocks.
Yet, the weekly also makes it clear the bulls still have a ton of work to do just to overcome a bigger (even if muted) headwind already in place. The 200-day moving average line not only looms just above, but is also sloped in a downward direction.
Bottom line? Stocks remain on the fence. A small dip is likely here, and bigger headwinds (for the bulls are in place), but the bigger trend is technically bullish. This week will make it clear how much conviction the bulls have.
Disclosure: None.


