
Weekly Market Outlook - 12% Up From Lows, Where To Now?

Weekly Market Outlook - March 21, 2016
We just completed the fifth straight bullish week for the market. The S&P 500 (SPX) (SPY) advanced 1.35% last week, clearing a couple of key resistance lines in the process. Yet, other resistance lines have yet to be hurdled, and could end up being problems that work against stocks now that the S&P 500 is up 12% from the February 11th low...enough to give all those would-be profit-takers something to think about.
We'll weigh the good and bad below, right after taking a closer look at this week's and last week's economic news.
Economic Data
Last week was a busy one in terms of economic news. And, the bulk of it was disappointing. Retail sales dwindled, inflation is tepid (although that worked out in our favor, letting the Fed back off on its rate hike plans), and industrial activity tiptoed a tad lower. Although it wasn't enough to derail the rally this time around, there are a few red flags worth exploring.
One of those red flags is the slight decline in February's Retail spending. With or without automobiles, consumers tightened their purse strings to the tune of -0.1%. It's the first time in a long time we've seen such a stagnation, so we don't want to read too much into it just yet. It's also worth noting -- and this is evident on our chart below -- the only weak, non-growth link is from gasoline stations, and that may have been the result of a huge plunge on gasoline prices last month.
Retail Sales Chart
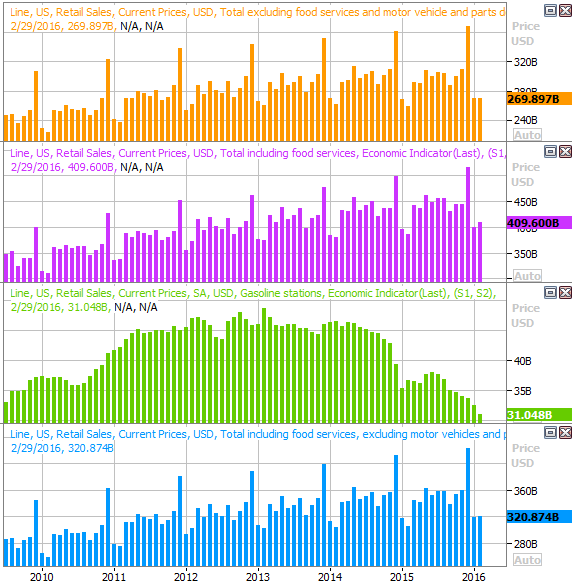
Source: Thomson Reuters
Whatever the case, we need a good showing on this front in March, even if only for psychological reasons.
Housing starts and building permits were also off a little, though more troubling was the fact that they came in below expectations at a point in time in the year when construction activity should be perking up... at least a bit.Nevertheless, the bigger trend here remains a positive one.
Housing Starts and Building Permits Chart
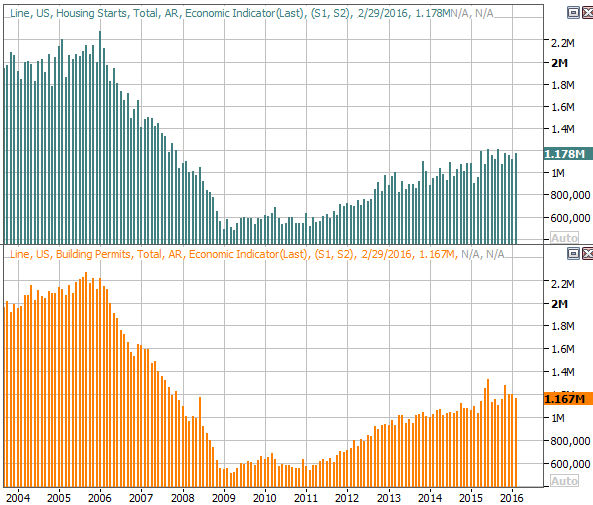
Source: Thomson Reuters
The only other chart we want to look at is one that doesn't get much attention from the media...capacity utilization and industrial production. This tends to be one of the better barometers of the overall market's health.As you can see, production continues to grind higher, but capacity utilization is still drifting lower.
Capacity Utilization and Industrial Productivity Chart
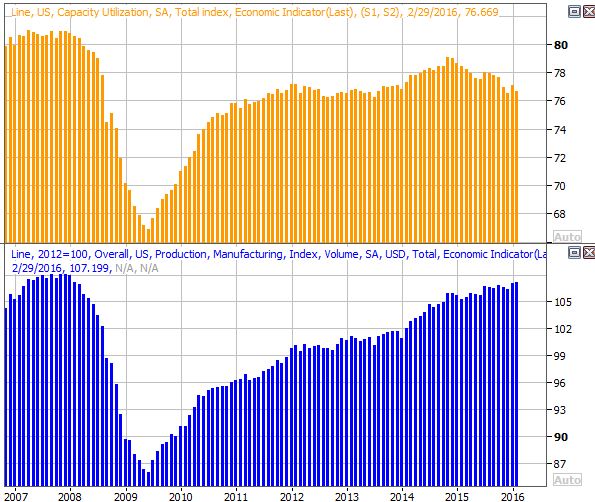
Source: Thomson Reuters
The market can survive the mixed message, though ideally both would be moving higher.As long as both are not moving lower at the same time, we're OK.It's also worth noting that at least some of the reduced capacity usage stems from an abundant supply of crude oil. Nevertheless, the waning capacity utilization remains a concern worth keeping tabs on.
We also heard February's inflation data last week. It was covered in more detail here on the BigTrends site here, but the gist is, inflation remains tame.
Economic Calendar
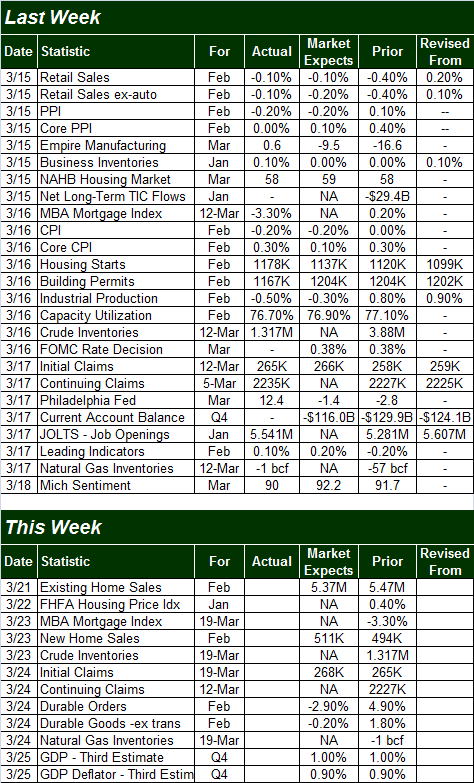
Source: Briefing.com
This week isn't going to be as hectic., though it will be a big one - again - for real estate. We'll hear last month's existing home sales data on Monday, and new home sales figures on Wednesday. Sandwiched between the two on Tuesday will be the FHFA Housing Price Index for January. They're all generally moving higher, but we want to make sure they continue to do so.
New, Existing Home Sales Chart
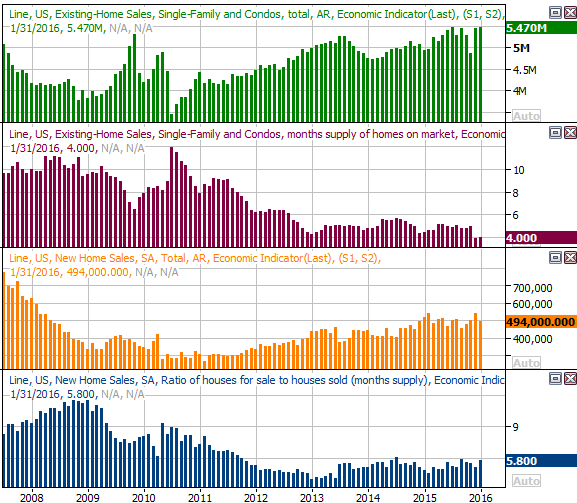
Source: Thomson Reuters
We'll look at the FHFA data next week along with the Case-Shiller Index next week.
Also note that we're not expecting the third and final reading on Q4's GDP growth to change from the second reading of 1.0%.
Stock Market Index Analysis
The broad market momentum is impressive, but this market hasn't been one to dish out long-term, uninterrupted moves in a long time.Moreover, if there was ever a point where the bears could and should make a stand and try and turn things around, this is it.
On the chart below, we can see that the S&P 500 finally pushed past the pivotal 200-day moving average line (green) around 2018 last week.That's the last of the key moving average lines the index would need to hurdle to confirm it was firing on all cylinders.The bulls aren't quite out of the woods just yet, however. There's a major resistance line (dashed) that extends all the way back to dive ending last year, tagging the three minor peaks the S&P 500 made en route to the January implosion.It's not likely a mere coincidence that Friday's rally paused at that same line.
S&P 500 & VIX Daily Chart
Chart created with TradeStation
Other than that, the technical picture remains decidedly bullish.We've seen repeated confirmations of the Percent R signal, the MACD indicator is still pointed in a bullish direction, and the CBOE Volatility Index (VIX) (VXX) still has some room to edge lower before finding a major floor at 12.0. (That said, know that the VIX is already testing the minor floor - though not shown on our chart - around 13.5.)
The Nasdaq Composite (COMP) has alarmingly failed to keep up with a technical progress of the S&P 500, still short of its 200-day moving average line (green). The Nasdaq Volatility Index (VXN) also has more room to edge lower until it meets a key floor at 14.3.
NASDAQ Composite & VXN Daily Chart

Chart created with TradeStation
This bodes well in the near-term, as it gives the Nasdaq room rally before hitting a major technical headwind. On the other hand,in the bigger-picture, a healthy rally would be one decidedly led by the Nasdaq rather than blue chips. The Composite is up almost 14% from the February 11th low, while the Dow Jones Industrial Average is up an impressive 12.4% for the same timeframe. That's not decisive leadership from the tech-heavy Nasdaq Composite... the kind you'd expect to see if a bullish mindset were prevailing. In fact, the DJIA (DIA) and S&P 500 are up for the year, while the Nasdaq remains in the red.
Zooming out to a weekly chart of the S&P 500 we can gain a little more perspective.It's in this timeframe we can see the scope of the recent rally, and recognize the fact that the index has yet to hit a much more important ceiling around 2135 where the index peaked several times in the first half of 2015, and where the upper 26-week Bollinger band is now.It's also on the weekly chart we can see how big of a deal the VIX's floor at 12.0 is.
S&P 500 & VIX Weekly Chart
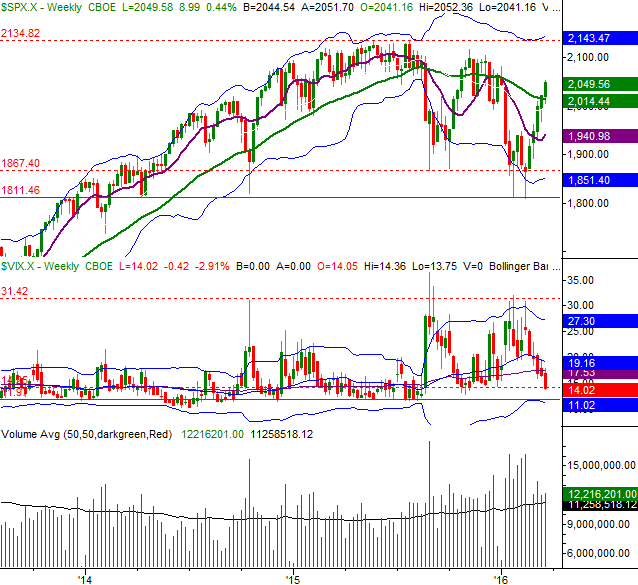
Chart created with TradeStation
While most outlook-oriented discussions of the market tend to lean bearishly or bullishly, in this particular case, the discussion would be incomplete without acknowledging that time frames matter.
In the very near-term, the bulls may have the momentum, that stocks are ripe for at least a modest push back to burn off some of the recently-developed froth.In the grand scheme of things, however, as long as the indices don't break under the recently-cleared support levels (like the 1990 area for the S&P 500), the uptrend could very easily remain alive, with the recent ceilings being shattered on the next bullish effort rather than the current one.
All the same, stocks should be viewed as an on-the-fence proposition at this time, with some key decisions being forced to be made near the end of the week. Although the market's overall valuation has already tiptoed into dangerous territory, a break above the ceilings the talked about could inspire another pretty good wave of buying.
Disclosure: None.


