Weekly Forex Forecast - Sunday, Nov. 9
Image Source: Unsplash
Fundamental Analysis & Market Sentiment
I wrote on the 2nd November that the best trades for the week would be:
- Long of the USD/JPY currency pair. The price fell by 0.38% over the week.
- Long of the S&P 500 Index following a daily close above 6,920. This did not set up.
- Long of the NASDAQ 100 Index following a daily close above 26,288. This did not set up.
- Long of the KOSPI Composite with a ¼ size position. The Index fell by 4.11% over the week.
- Long of the Nikkei 225 Index with a ¼ size position. The Index fell by 3.86% over the week.
These trades produced an overall loss of 2.37%, representing an average loss of 0.47% per asset.
A summary of last week’s most important data:
- ADP Non-Farm Employment Change – the data was a little better than expected for the US economy, suggesting that 42k new jobs were created in the USA last month compared to the expected 32k.
- US ISM Services PMI – the data was better than expected, again suggesting the US economy is a bit stronger than generally seen.
- US ISM Manufacturing PMI – the data was worse than expected, suggesting the manufacturing sector is doing considerably worse than the series sector.
- Bank of England Official Bank Rate, Monetary Policy Summary & Report – the Bank voted to hold its interest rate at 4% as expected, but the vote was surprisingly close with increasing votes to cut. This weakened the Pound earlier in the week, but the Pound regained its losses on Friday as risky assets staged a strong recovery at the New York open.
- RBA Rate and Monetary Policy Statements – the Bank voted to hold its interest rate at 3.60% which was no surprise.
- Swiss CPI (inflation) – the rate showed deflation, not inflation, and at a relatively strong month-on-month rate of 0.3%. This is helping to strengthen the Swiss Franc.
- Canada Unemployment Rate – better than expected at 6.9%, but it is still a relatively high rate. This had little effect on the Loonie (the CAD).
- New Zealand Unemployment Rate – came in at 5.3% as expected.
There were a few US data items which were due last week, but they were postponed due to the ongoing US federal government shutdown.
Last week’s biggest data events were the stronger US jobs numbers, which helped rally the US market a bit, and the Bank of England getting closer to cutting rates. Yet the major event of the week was the selloff in stock markets, which was the strongest seen in months, although Friday’s New York session saw a strong bullish turnaround. However, almost all major stock markets were lower over the week. There has been increasing concerns that prices are overstretched and corporate valuations, especially in tech, are unrealistically high.
It was also notable that the new bullish trend in the US Dollar lost momentum, with the CME FedWatch tool suggesting the chance of a December rate cut of 0.25% has increased from 63% to 70%. However, the US Dollar did regain ground on Friday.
The US Supreme Court looks about 60% likely to rule against President Trump on the constitutional authority he is using to impose tariffs. President Trump will have other methods at his disposal if the Court rules like this, but they will be harder for him to use.
The US government shut down goes on but is having little effect beyond preventing us from getting US economic data updates.
The USA, Canada, and France have public holidays this Tuesday.
The Week Ahead: 10th - 14th November
The coming week will depend a lot on whether the US government shutdown ends, as the release of crucial US inflation data is scheduled, but it will not be released if the shutdown continues over Thursday. There is also US PPI data due Friday and there is the same situation with that.
This week’s most important data points, in order of likely importance, are:
- US CPI (inflation)
- US PPI
- US Retail Sales
- UK GDP
- US Unemployment Claims
- Australia Unemployment Rate
- UK Unemployment Claims
The USA, Canada, and France have public holidays this Tuesday.
Due to the ongoing government shutdown in the USA, US data may be postponed indefinitely.
Monthly Forecast November 2025
(Click on image to enlarge)

Currency Price Changes and Interest Rates
For the month of November 2025, I forecasted that the USD/JPY currency pair would increase in value.
Its performance so far is shown within the table below.
(Click on image to enlarge)
![]()
November 2025 Monthly Forecast Performance to Date
Weekly Forecast 9th November 2025
I made no weekly forecast last week.
There was one unusually large price movement in currency crosses, so I forecast that the NZD/JPY currency cross is likely to rise in value over the coming week, despite the long-term weakness in the New Zealand Dollar.
The Japanese Yen was the strongest major currency last week, while the New Zealand Dollar was the weakest. Directional volatility decreased last week, with 22% of all major pairs and crosses changing in value by more than 1%.
Next week’s volatility will depend upon whether the US government shutdown continues. If it ends, we will get extremely import US data that will likely cause an increase in volatility.
Technical Analysis
Key Support/Resistance Levels for Popular Pairs
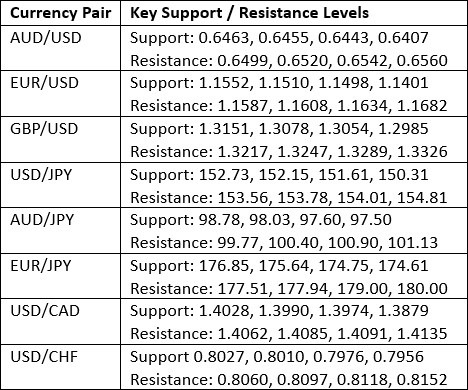
Key Support and Resistance Levels
US Dollar Index
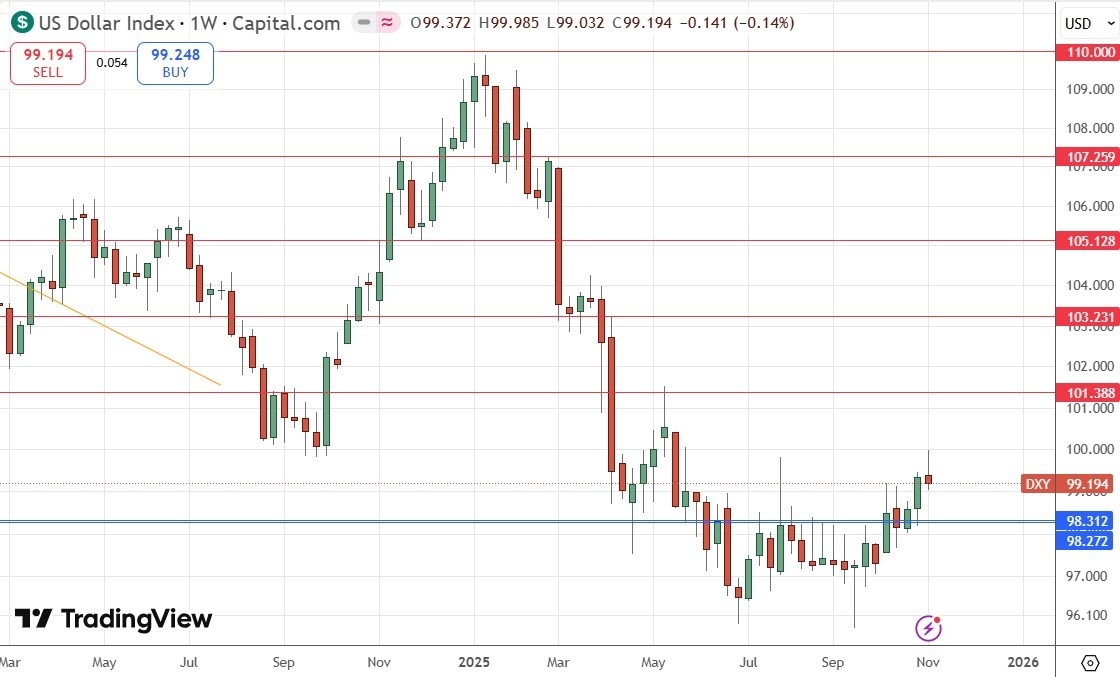
Last week, the US Dollar Index printed a bearish candlestick was almost a pin bar. Despite being somewhat below its level of 26 weeks ago, the price is above where it was 13 weeks ago, so by my preferred metric, I can declare the long-term bearish trend is over. This places the US Dollar in an interesting position and very close to technically starting a new long-term bullish trend.
The Dollar got a knock from markets being a bit less inclined to believe that the Federal Reserve will not cut rates at its next meeting on 10th December, with markets now pricing in a 70% chance of this cut happening, up from 63% one week ago.
We are missing crucial US data on inflation and inflation-related metrics due to the US government shutdown. If the shutdown ends, the Dollar’s price is likely to be driven by whatever results we get on inflation and PPI. Otherwise, it is probably most likely that the Dollar will chop around with more action in other currencies which are showing more directional price movement.
I am still more comfortable being long than short of the USD.
(Click on image to enlarge)
US Dollar Index Weekly Price Chart
NZD/USD
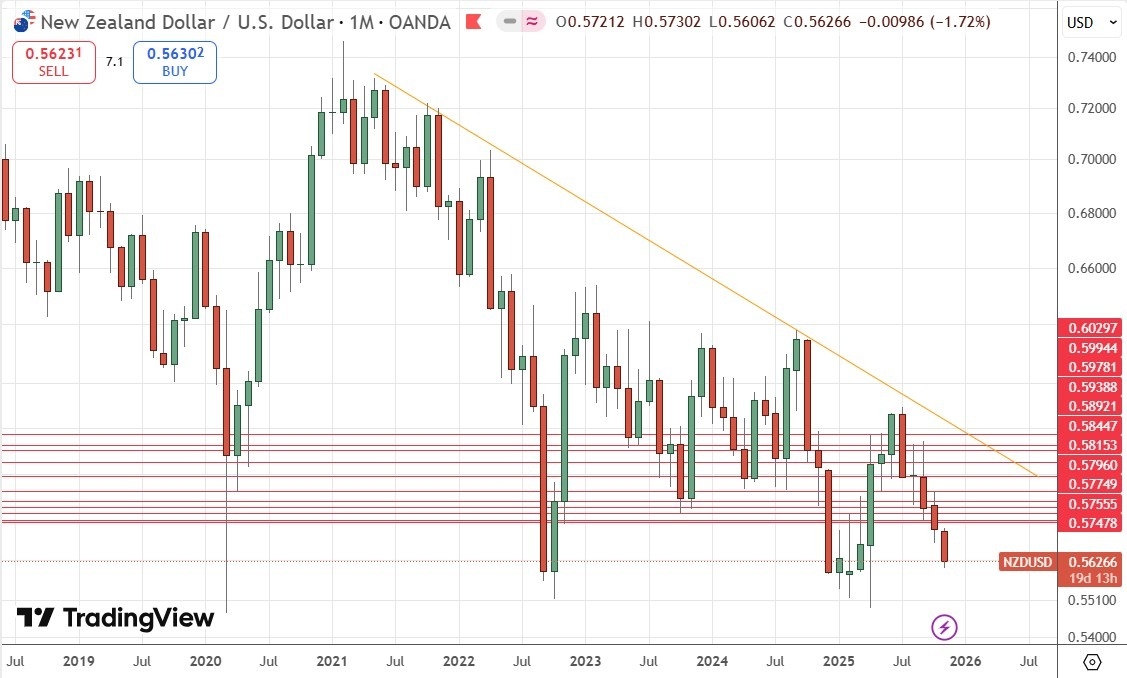
The NZD/USD currency pair fell strongly last week, with the New Zealand Dollar the standout currency as last week’s big mover over a week of relatively low directional volatility., even though the US Dollar lost a little ground.
The Kiwi (New Zealand Dollar) is being driven lower by a central bank which has been placed in a very difficult condition by an increasingly recessionary, shrinking economy. The RBNZ will almost certainly have to cut rates further, and when global risk sentiment deteriorates as it did last week, the highly exposed and commodity-oriented New Zealand economy looks even more vulnerable to further shrinkage.
Despite these fundamental factors which point emphatically towards more downside, the long-term monthly price chart below shows that over a very long period, the Kiwi has tended to find very long-term bottoms in this currency pair around $0.5500, which seems to be a real line in the sand. Despite that, the lower highs bounded by the descending trend line do suggest a major breakdown could be on the cards.
Although last week’s move was a bit over-extended, it would be logical to expect the price here to eventually fall to the $0.5500 area, before perhaps making a major rebound. If the price gets well-established below $0.5500, that would be a very dramatic development for the Kiwi.
(Click on image to enlarge)
NZD/USD Monthly Price Chart
USD/JPY
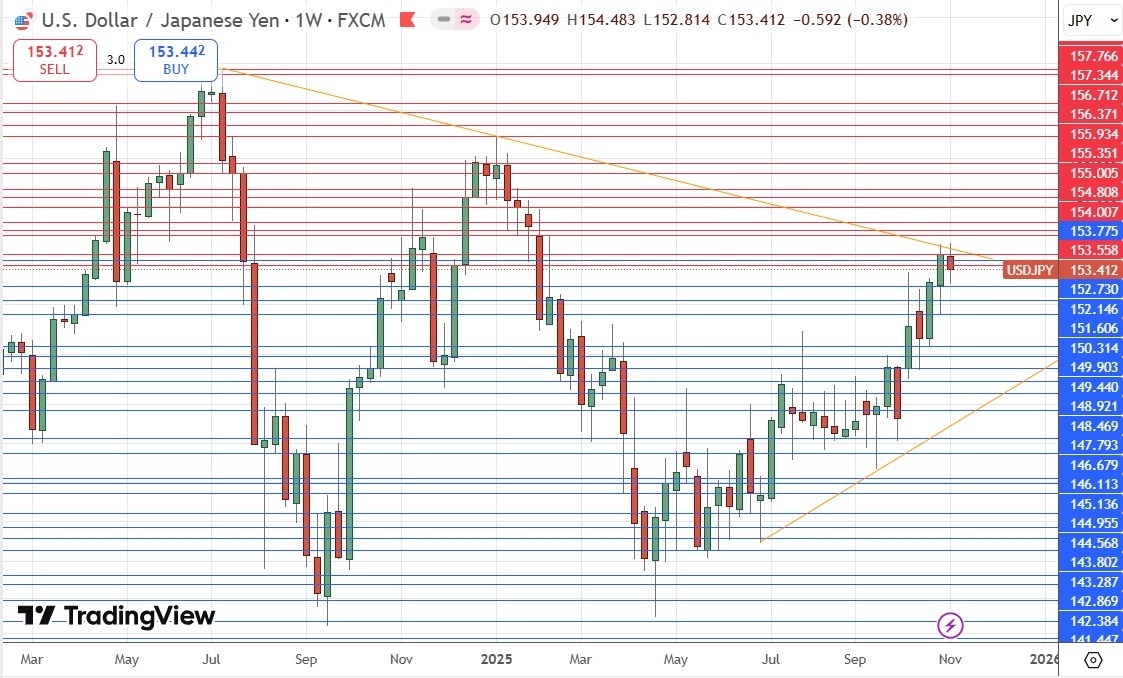
The USD/JPY currency pair weekly chart printed a weakly bearish, indecisive candlestick. Although we are technically in a long-term bullish trend here, the key thing to see in the chart below is that the price remains contained within a consolidating triangle chart pattern.
There is new uncertainly regarding both the greenback and the Yen. The US’s Dollar is starting to get into a new long-term bullish trend, but the trend is showing signs of faltering or not really getting properly established. Although the Japanese Yen has a lot of long-term weakness, inflationary pressures and hence pressures for the Bank of Japan to conduct another rate hike after years and years of ultra-loose monetary policy, are growing.
I think the appropriate course of action for most traders will be to wait for a bullish breakout above the upper trend line before entering a new long trade. That would be something like a daily close above ¥154.25 or, to be safe, maybe the big round number at ¥155.00.
(Click on image to enlarge)
USD/JPY Weekly Price Chart
S&P 500 Index
The weekly price chart below shows that even though last week saw this index make a strong fall, it bounced back on Friday to claw back about half of the week’s loss. There is a lot of speculation that the US stock market is overdue a major correction, but it still hasn’t happened yet. The golden line in the price chart is where we will start to see institutions reducing, or even exiting, their long positions.
We are still a bull market, and the trend is a strong upwards one. So, I think traders with existing positions should sit tight until we get below 6,620 or maybe even 6,500. However, I think entering a new trade now would be foolish unless one day over the coming week we see the price close at a new record high, above 6,920.
Another issue for bulls to be concerned about is the big round number at 7,000 coming into view, which might trigger considerable profit-taking if reached.
(Click on image to enlarge)
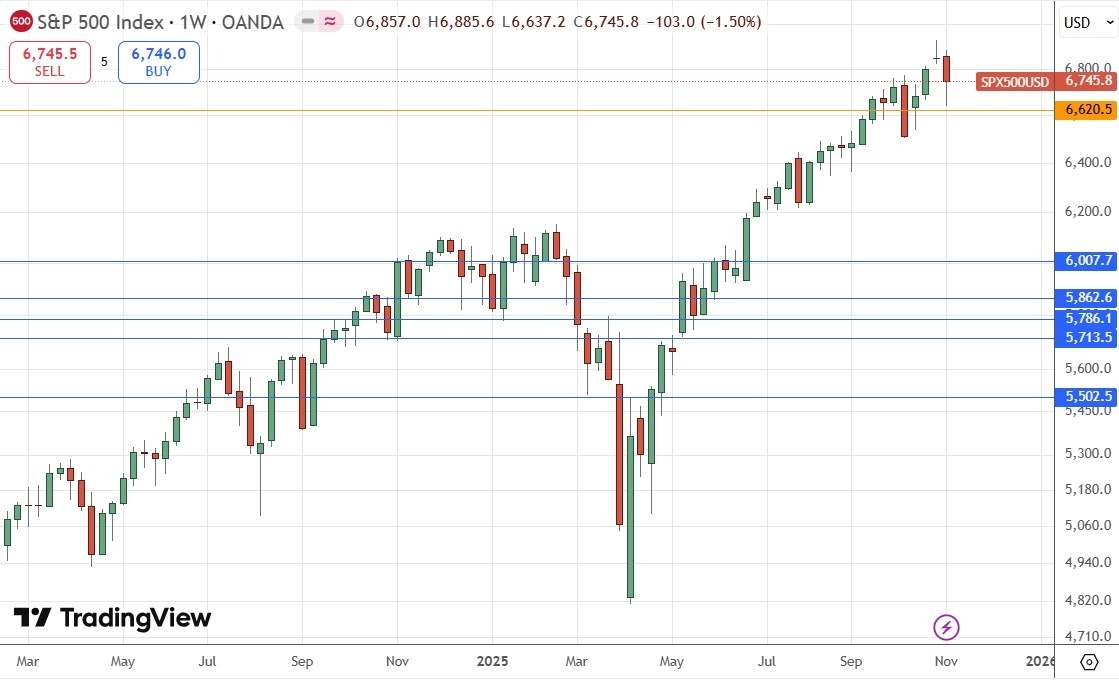
S&P 500 Index Weekly Price Chart
NASDAQ 100 Index
Everything I wrote above about the S&P 500 Index also applies to the NASDAQ 100 Index, but it is worth noting that the NASDAQ 100 Index saw the price trade below the zone where institutions will start to exit before making quite strong gains. What probably happened is that institutions saw this as a buying opportunity, which would be a bullish sign if the rise were more convincing.
It is notable that technology stocks look more vulnerable than the broader stock market. You can take this as a bearish sign, as the recent strong rally in the US stock market is heavily driven by AI.
Just like with the S&P 500, I think it is worth sitting tight for an existing position but not entering any new trades until there is a new all-time high made with a close above 26,288.
(Click on image to enlarge)
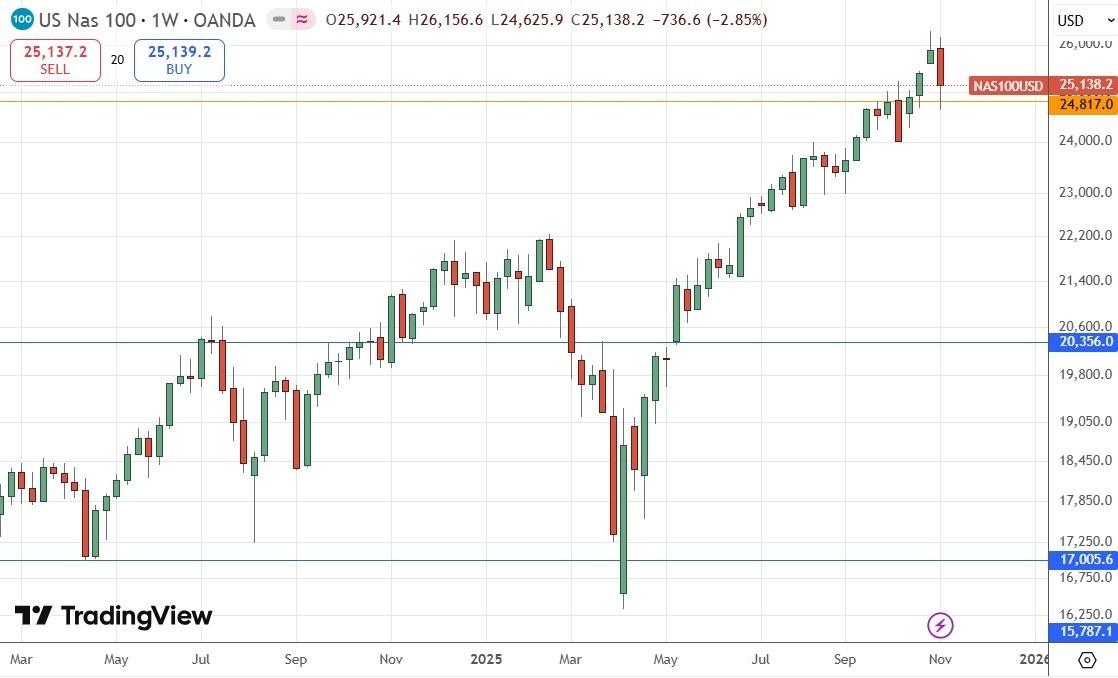
NASDAQ 100 Index Weekly Price Chart
Nikkei 225 Index
The main Japanese equity index the Nikkei 225 has put in a great performance this year, surpassing even the traditionally dominant US market. The Index is up by more than 63% since April, an astonishing advance, driven partly by the global bull market and partly by an increasing sense that Japan is really coming back economically after a long period of deflation. This was given a tailwind last week by the Bank of Japan’s refusal to hike its (relatively very low) interest rate.
A new long trade might be late to the party, but a quarter-sized long position using a trailing stop could be a sensible trade.
The price closing right on a record high on a large range is certainly a very bullish sign, and this Index is outperforming even the KOSPI Composite, so I think it makes sense to be long here.
(Click on image to enlarge)
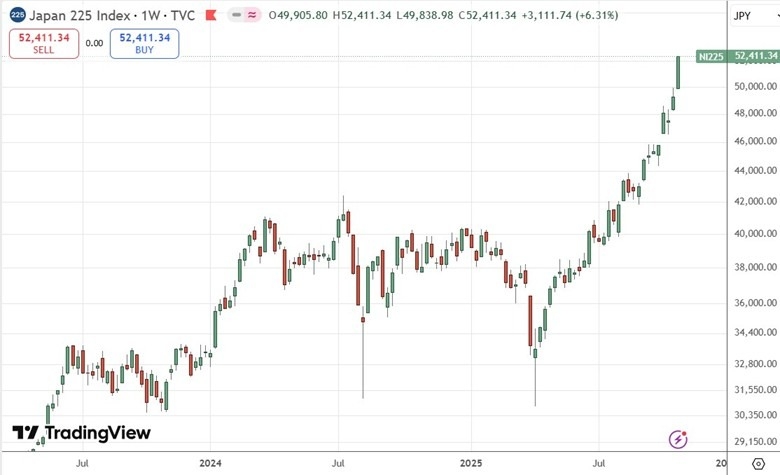
Nikkei 225 Index Weekly Price Chart
Bottom Line
I see the best trades this week as:
- Long of the USD/JPY currency pair following a daily close above ¥154.25.
- Long of the S&P 500 Index following a daily close above 6,920.
- Long of the NASDAQ 100 Index following a daily close above 26,288.
More By This Author:
EUR/USD Forex Signal: Bullish Breakout From Bearish Price Channel
Eli Lilly And Company Stock Signal: Did Earnings Justify The Rally?
AUD/USD Forex Signal: Accelerating Breakdown On Risk-Off Sentiment
Risk Disclaimer: DailyForex will not be held liable for any loss or damage resulting from reliance on the information contained within this website including market news, analysis, trading signals ...
more


