Weekly Forex Forecast - Sunday, Nov. 10
Image Source: Unsplash
Fundamental Analysis & Market Sentiment
I previously wrote on Sunday, Nov. 3 that the best trade opportunities for the week were likely to be:
- Long of gold in US dollar terms following a daily close above $2,787. This did not set up.
- Long of the S&P 500 Index following a daily close above 5,878. This set up at Wednesday’s close, and the Index rose by a further 1.12% over the remainder of the week.
The weekly gain of 1.12% equals 0.56% per asset.
Meanwhile, last week’s key takeaways were:
- US Presidential and Congressional Elections – President Trump won the election surprisingly strongly, winning the popular vote by 2.5% (not a landslide) and all the swing states. Republicans have also taken control of the Senate and look set to retain control of the House, meaning that all branches of government will effectively have Republican majorities. So, it seems as if America is in for some changes in policy, which may boost stock markets, cryptocurrencies, and to a lesser extent, the US dollar.
- US Federal Funds Rate and FOMC Statement – the Fed voted unanimously to cut rates by 0.25%, as was strongly expected, and is now holding employment equal to inflation in its calculations. However, it can be said there were no real surprises here.
- Bank of England Official Bank Rate, Votes, Monetary Policy Statement and Report – the Bank cut its interest rate by 0.25%, as expected. Governor Bailey took an optimistic tone about inflation continuing to decline slowly. The pound declined slightly following the release, but it was nothing special.
- Reserve Bank of Australia Cash Rate, Rate Statement, and Monetary Policy Statement – as expected, rates were left on hold, with the Bank dodging questions about the timing of future cuts, saying only that inflation remains too high. This seemed to have little influence on the value of the Aussie.
- US ISM Services PMI – this was slightly higher than expected, suggesting stronger economic activity in the services sector.
- US Unemployment Claims – this came in as expected.
- Canada Unemployment Rate – this was expected to tick higher, but it remained unchanged, suggesting a fractionally stronger labor market.
- New Zealand Unemployment Rate – this fell by more than expected, from 5.0% to 4.8%, suggesting an unexpectedly strong labor market.
The Week Ahead: Nov. 11-15, 2024
The coming week’s schedule is shorter but includes two items that have the potential to make a very big impact: data from the USA on CPI (inflation) and PPI (purchasing power index), which will give big clues about the future timing of the Fed's rate hikes.
- US CPI (inflation)
- US PPI
- US Retail Sales
- UK GDP
- Australian Wage Price Index
- New Zealand Inflation Expectations
- UK Claimant Count Change (Unemployment Claims)
- Australian Unemployment Rate
Monthly Forecast November for 2024
(Click on image to enlarge)
I made no monthly forecast for November, as the long-term trends in the Forex market have been too unclear.
Weekly Forecast for Sunday, Nov. 10, 2024
I made no weekly forecast this week, as there were no unusually strong directional price movements over the past trading period, which is the basis of my weekly trading strategy.
Last week, the Japanese yen was the strongest major currency, while the euro was the weakest. However, the number was relatively low, so this is probably not a meaningful statistic.
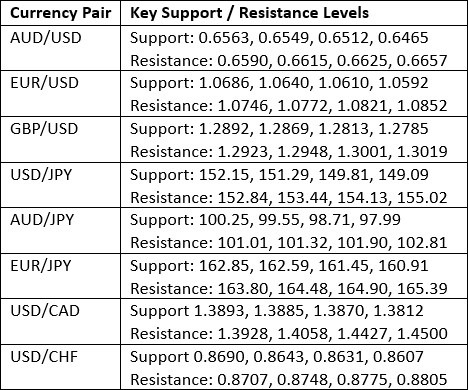
Key Support/Resistance Levels for Popular Pairs
Technical Analysis - US Dollar Index
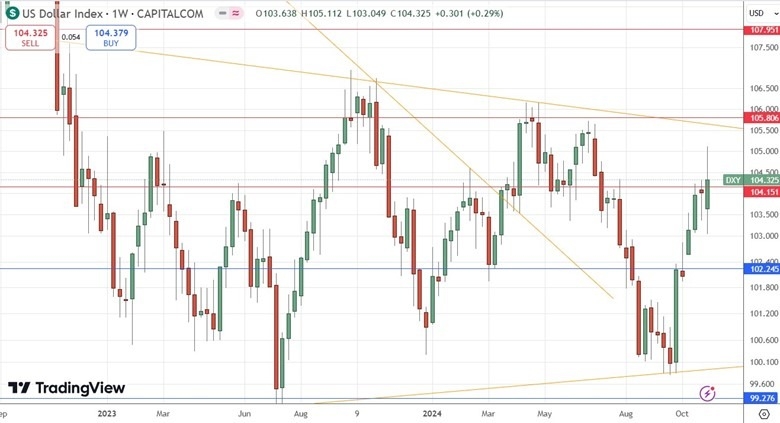
Last week, the US Dollar Index printed a bullish engulfing candlestick that successfully broke out beyond the resistance level at 104.15. This is a bullish sign, but it should be noted that the candlestick has a large upper wick, showing that the dollar struggled to hold some of its earlier gains.
The price is above its level from three months ago but below its level from six months ago, suggesting a long-term mixed trend in the greenback, which indicates uncertainty.
It is also worth noting that despite the recent bullish momentum, the price is trading not far from the middle of a consolidating triangle chart pattern. This is suggestive of ultimately ranging behavior.
This week's outlook for the US dollar remains unclear despite President Trump's election and the near certainty that the Republicans will control both Houses of Congress, which should have strengthened the US dollar. The dollar has strengthened, but not as much as we expected. This may be a sign that the dollar is not going to rise much more.
Be very careful in trading the US dollar long this week. If the price can establish itself above the triangle pattern’s upper trend line and the horizontal level at 105.81, that would be a decisive bullish sign to respect.
(Click on image to enlarge)
EUR/USD
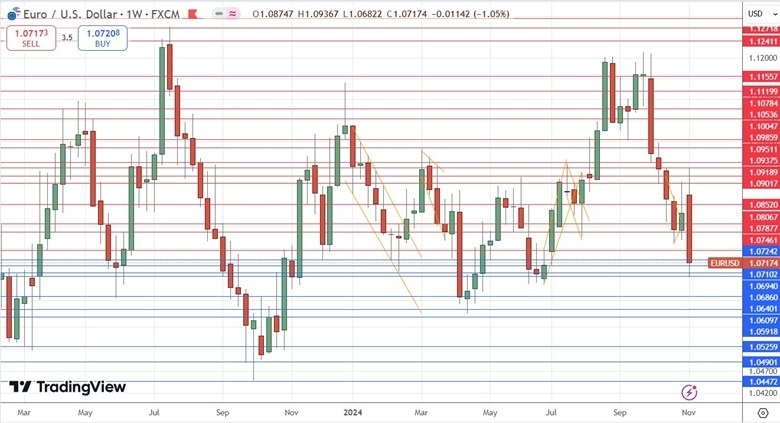
Last week, the US dollar strengthened due to the decisive Republican victory in the US general election. The euro has been one of the weakest major currencies. These two factors gave us one of the strongest directional price movements in the Forex market last week in the EUR/USD currency pair.
The weekly candlestick closed near its low, and the price reached its lowest level in over four months. The price is below its levels from both three and six months ago, which is my preferred metric for calling a long-term bearish trend.
So, it seems there are plenty of reasons to go short here, but I still see a few reasons to remain cautious:
- The shorter-term moving averages are above the longer-term moving averages, suggesting that this could be more of a spike lower than a trend—or at least that this trend is not mature enough to be reliable.
- Two bullish inflection points are close by, at $1.0666 and $1.0600. Short trades may be safer below the $1.0600 area.
(Click on image to enlarge)
USD/JPY
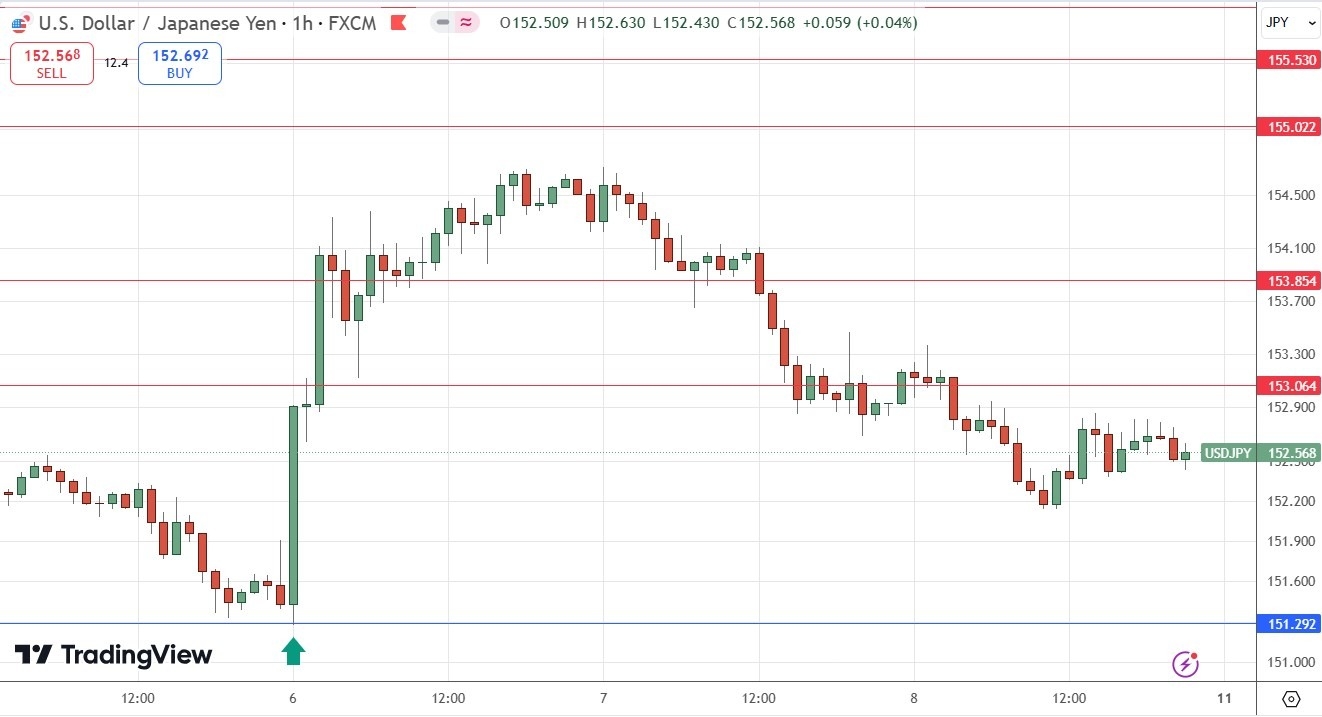
I expected to see the USD/JPY currency pair to have potential support at the JPY151.29 level.
The H1 price chart below shows how the price action rejected this support level with a large outside bar/engulfing candlestick, marked by the upward arrow. This rejection occurred right at the start of the Tokyo session last Wednesday, which can often be a great time to find powerful reversals in the Japanese yen.
This trade reached a floating profit approximately as large as the risk if the stop was placed just below the swing low, which was the low of the week.
I am not sure that this currency pair is respecting technical factors much right now. It seems to be pushed around by macro factors rather than its own parameters, so it is probably not a good currency pair for technical traders now. However, there is volatility left in it, so day traders could find catching swings here an interesting project.
(Click on image to enlarge)
Bitcoin
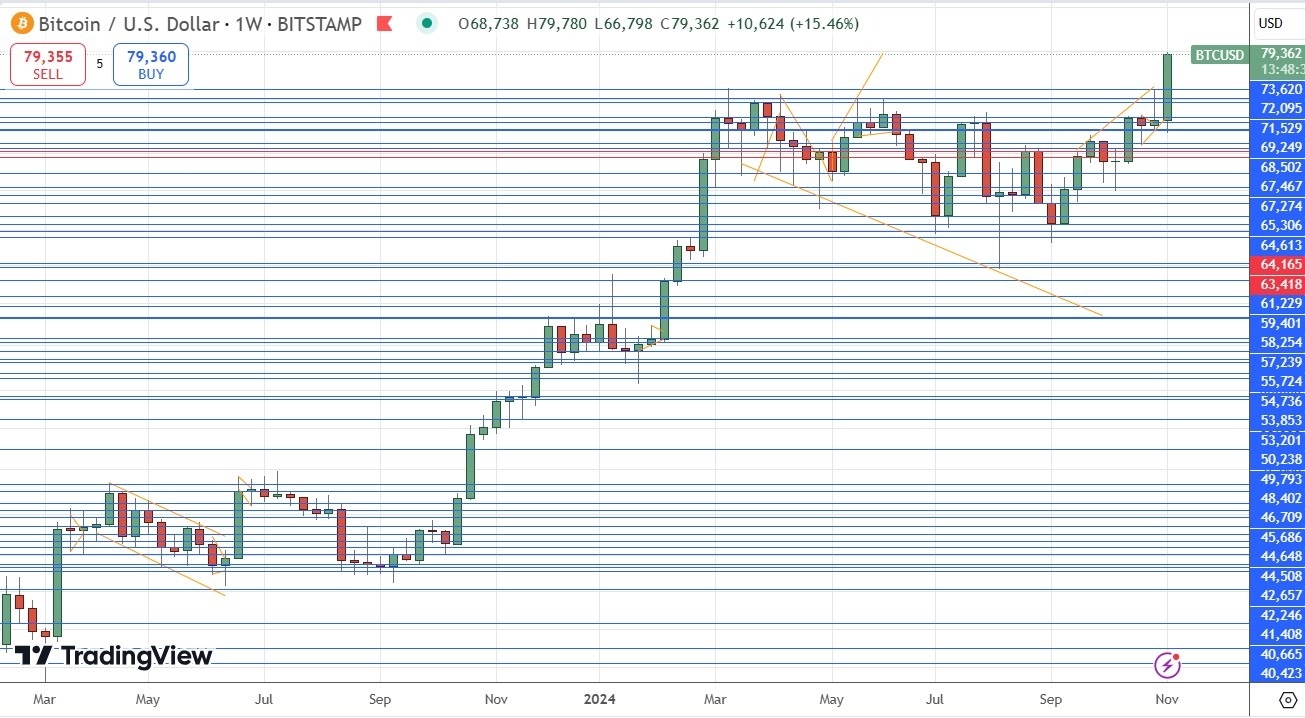
Bitcoin, even in US dollar terms, gained strongly over the past week, getting a significant boost from the election victories of President Trump and Congressional Republicans in both Houses. Republicans are seen as more likely to favor lighter regulation of cryptocurrency, so their ascendancy has boosted both cryptocurrency in particular and risk sentiment in general, which can also help a risky asset like Bitcoin.
Bitcoin traded over the weekend, and on Saturday and Sunday, it continued rising to new record highs. The screenshot below was taken on Sunday, and we can see there is hardly any upper wick on this candlestick, which is a very bullish sign, especially as the price is trading firmly within blue sky territory and the candlestick is relatively large.
There is every reason to be bullish on Bitcoin right now, and I am long of Bitcoin. However, I noticed that Bitcoin ETFs do not seem to be getting the full gain made by the underlying -- not in some way, so if you can afford it, you might want to buy Bitcoin futures instead of a Bitcoin ETF or even spot Bitcoin itself if you can. There are Bitcoin micro futures available on the CME, which are only sized at 10% of the value of one Bitcoin.
(Click on image to enlarge)
Nasdaq 100 Index
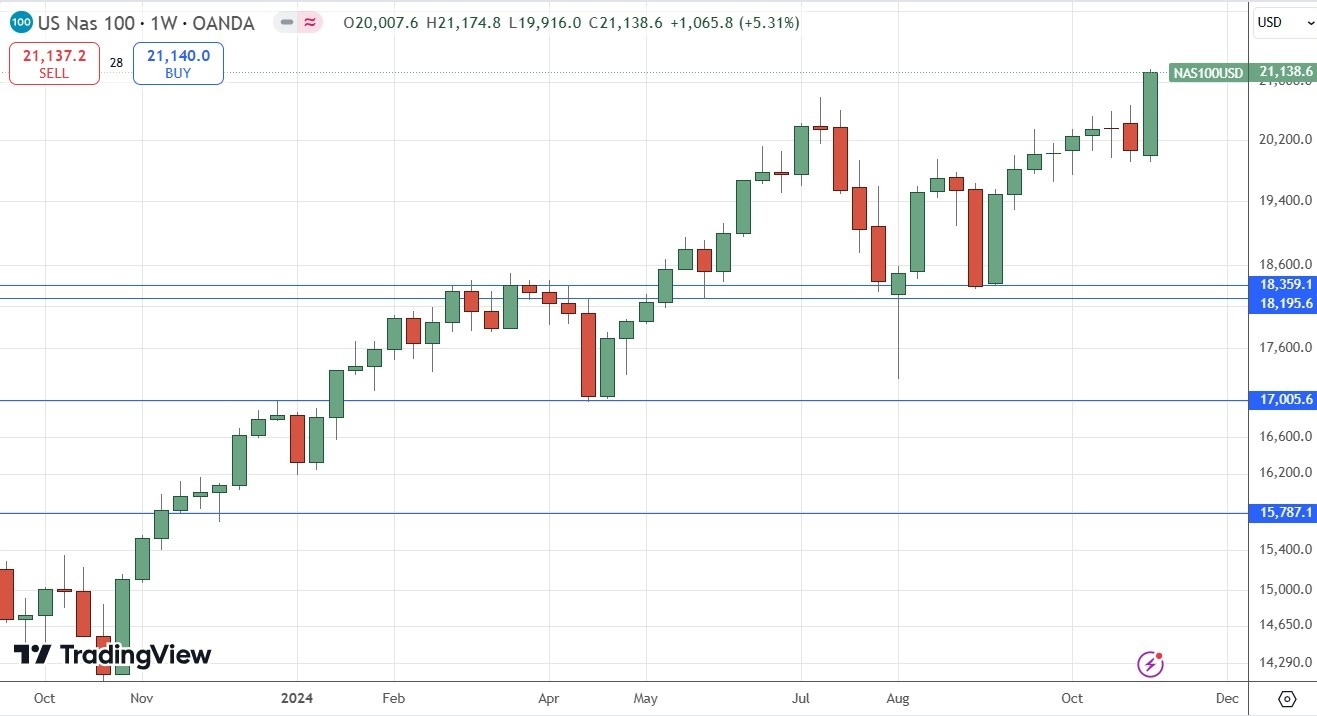
US stock markets have been in bullish territory for quite a while, but the Nasdaq 100 Index has been mostly consolidating for a few months after making a record high early in the year on the back of strong gains. In recent years, it has been excellent for many major tech stocks that are members of this index.
The bullish breakout led to new record highs after the Republican clean sweep in the US general election. In 2016, when President Trump was first elected, the rally in the broader stock market triggered by his election was bigger than the rally seen in the tech sector.
However, that may be different now as Trump is seen as having become friendlier to the tech sector—this might also be connected to the fact that Elon Musk is going to play a role in the new administration.
There is almost no upper wick on the weekly candlestick here, and the candlestick is of a relatively large size, so there seems to be every reason to be long of this Index. I see the Nasdaq 100 Index as a buy.
(Click on image to enlarge)
S&P 500 Index
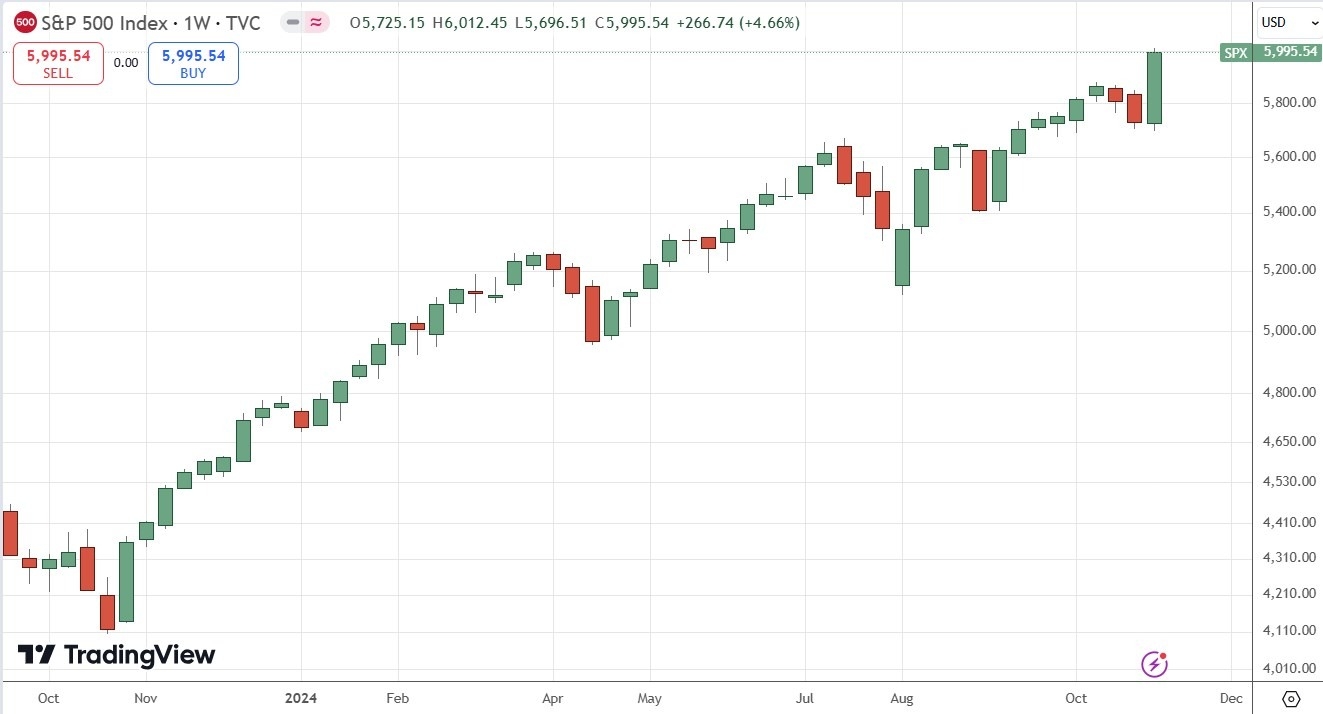
I wrote last week that this major, broad US stock market Index would likely make a bullish breakout to new record high prices if Trump won the US Presidential election. This was a good, accurate call.
The election of a new President has historically triggered quite large rallies in the US stock market. President Trump is famously pro-business, and Republicans look extremely likely to have captured both Houses of Congress, so we may be in for a renewed rally in this Index. Undoubtedly, the election results pushed the price strongly into blue sky.
Interestingly, the Nasdaq 100 Index rose slightly more than the broader S&P 500 Index. This suggests that a big rally might be more skewed towards tech stocks, but it is also true the Nasdaq 100 is just more volatile, so this differential might not be very significant.
There is almost no upper wick on the weekly candlestick here, and the candlestick is of a relatively large size, so there seems to be every reason to be long of this Index. I see the S&P 500 Index as a buy.
(Click on image to enlarge)
Bottom Line
I see the best trading opportunities this week as:
- Long of Bitcoin in US dollar terms.
- Long of the S&P 500 Index.
- Long of the Nasdaq 100 Index.
More By This Author:
Forex Today: US Fed, Bank Of England Both Expected To Cut Rates By 0.25%EUR/USD Forex Signal: Trump Victory Sends Dollar Soaring
AUD/USD Forex Signal: Bulls Break Out From The Bearish Price Channel
Risk Disclaimer: DailyForex will not be held liable for any loss or damage resulting from reliance on the information contained within this website including market news, analysis, trading signals ...
more


