Weekly Forex Forecast - Sunday, May 11

Image Source: Pixabay
Fundamental Analysis & Market Sentiment
I previously wrote on Sunday, May 4, 2025 that the best trades for the week would be the following:
- Long of the EUR/USD currency pair following a daily (New York) close above $1.1517. This did not set up.
- Short of the USD/MXN currency pair following a daily (New York) close below $19.4333. Unfortunately, this did not set up until the end of the week.
Last week saw a calmer and more bullish market as we seem to have really moved beyond any new tariff bombshells. A trade deal between the UK and the US was announced, the first such deal since Trump regained office last January. Trump has touted the deal, as well as ongoing negotiations with several nations in the current trade dispute, and this has given the market confidence to almost forget about it. However, the July deadline remains for trade deals, and this issue will heat up again as July approaches.
Beyond that, although not especially significant, the major events of last week were the slightly hawkish rhetoric from Jerome Powell about an elevated risk of inflation requiring rates to be kept higher for longer, and the Bank of England’s widely expected 0.25% rate cut. Swiss CPI was also of some interest as it showed no monthly inflation at all, when an increase of 0.2% was expected, suggesting inflationary pressures in Europe might be easing off.
The Week Ahead: May 12-16, 2025
The coming week has a less intense schedule of important releases but notably will include policy meetings at the US Federal Reserve and the Bank of England. This week’s significant data points, in order of likely importance, are as follows:
- US CPI (inflation)
- US PPI
- US Preliminary UoM Inflation Expectations
- US Preliminary UoM Consumer Sentiment Expectations
- UK GDP
- Australia Wage Price Index
- US Unemployment Claims
- UK Claimant Count Change (Unemployment Claims)
- Australia Unemployment Rate
The top three items in the above list will likely drive the US dollar and stock markets, as well as other markets too. If the data is higher than expected, that will boost the dollar and sink stocks; if lower than expected, the opposite will probably occur.
Monthly Forecast for May 2025
(Click on image to enlarge)
For the month of May 2025, I did not provide a monthly forecast. Although there was a long-term trend against the US dollar, the price action suggested that a major bullish reversal could be underway.
Weekly Forecast for Sunday, May 11, 2025
As there were no unusually large price movements in Forex currency crosses over the past week, I once again will not provide a weekly forecast.
The British pound was the strongest major currency last week, while the Canadian dollar was the weakest. Volatility decreased again over this period, as only one of the most important Forex currency pairs and crosses changed in value by more than 1%. Next week will likely see higher volatility as there are some very important economic data releases scheduled, such as US CPI (inflation).
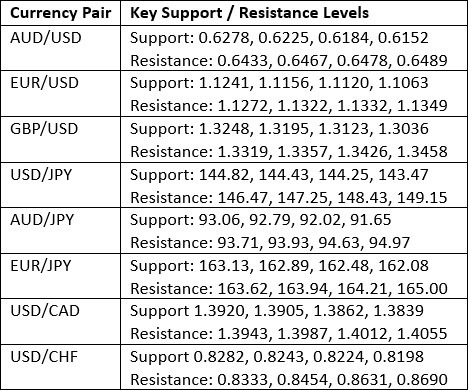
Key Support/Resistance Levels for Popular Pairs
Technical Analysis - US Dollar Index
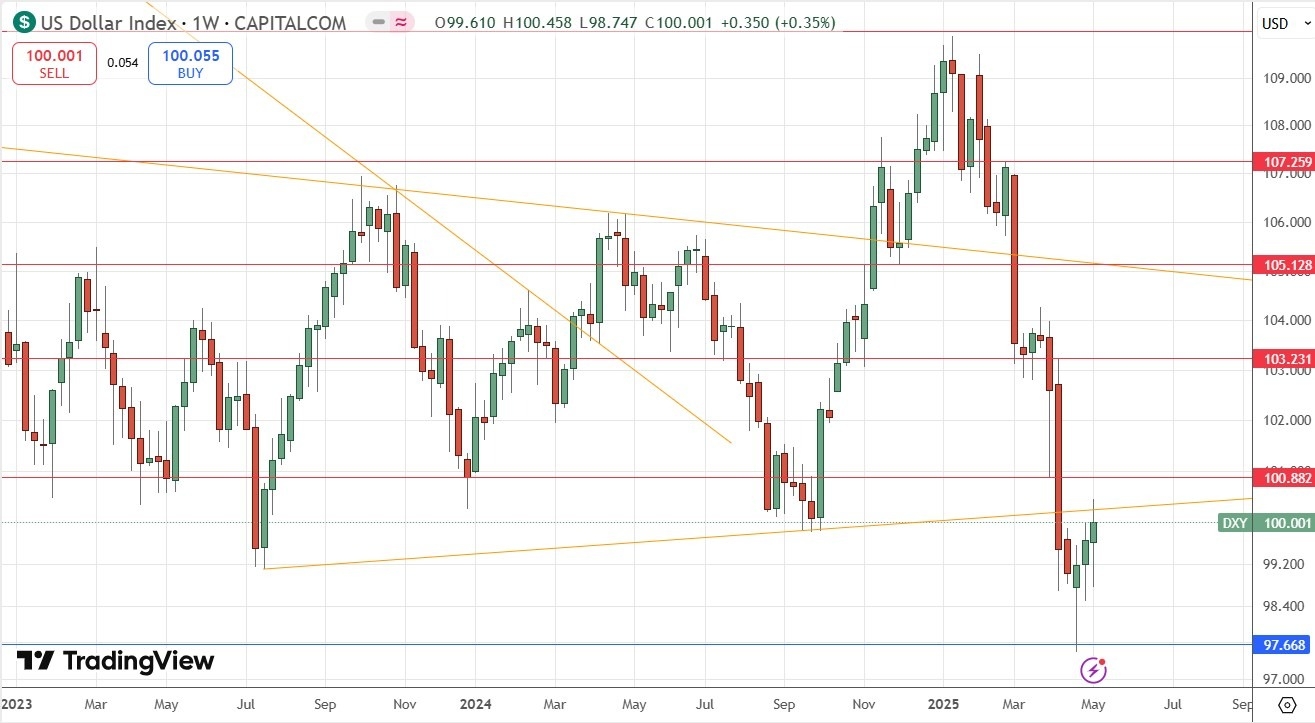
Last week, the US Dollar Index printed a bullish candlestick which closed above the previous week’s high price. This is the third consecutive bullish week. The price reached a new four-year low three weeks ago before bouncing strongly off the support level shown in the price chart below, at 97.67. As the rise has continued, these all seem to be bullish signs, but the long-term bearish trend is a bearish indicator.
It is hard to say what will happen to the US dollar next week after this bullish bounce, but trading in line with the long-term trend would be short of the greenback. However, we certainly have short-term bullish momentum which might not be wise to trade against. Much may depend on the UC CPI and PPI data which will be released this week.
(Click on image to enlarge)
The Nasdaq 100 Index
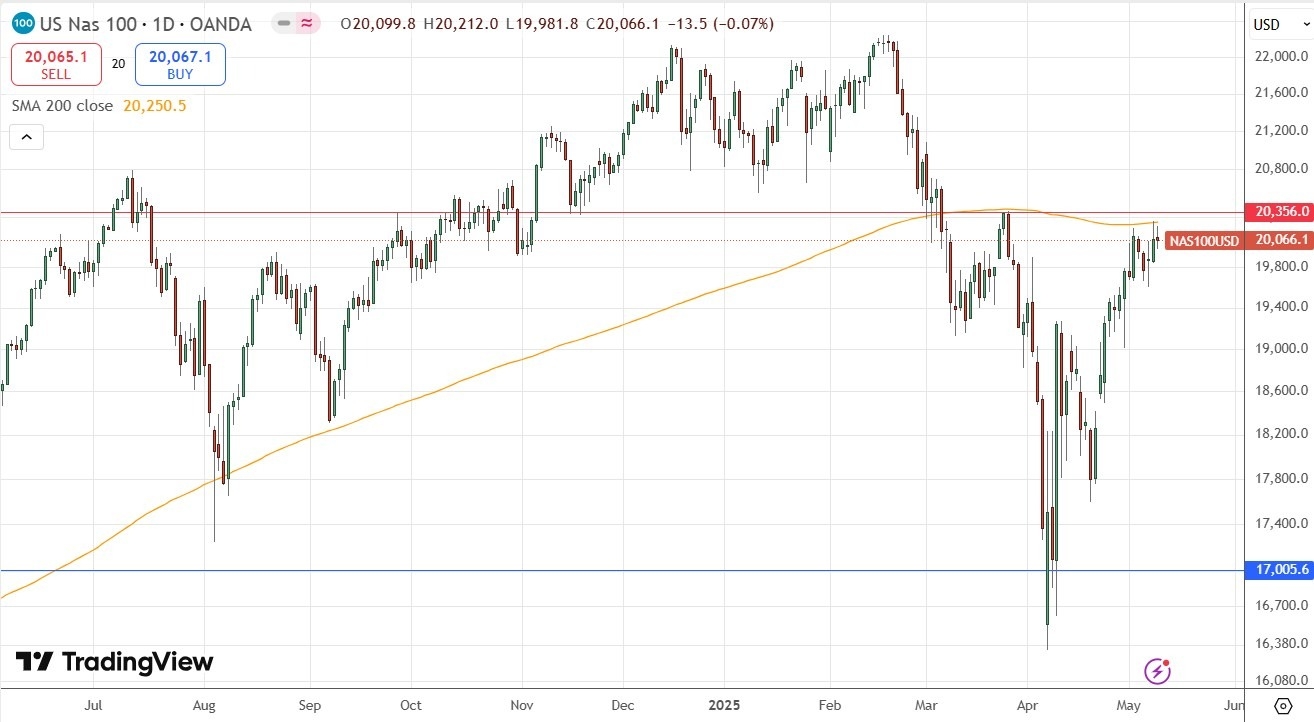
The Nasdaq 100 Index advanced a bit again last week on improved risk sentiment, despite the stronger US dollar which got a minor tailwind from a slightly hawkish FOMC meeting last week. Some tailwind may have been provided by the Trump administration’s decision to remove controls on chip exports.
Technically, the interesting thing here is that the price has touched and rejected the 200-day simple moving average, which is traditionally a key marker as to whether a market is bullish or bearish, with a bear market seeing the price below the average, as it is today.
Another technical factor is the horizontal resistance level at 20,356 which is confluent with the moving average, so this price area can be expected to put up some resistance.
If the price rejects this resistant area firmly, it could signal the start of another bearish downwards leg which might profitably traded short. On the other hand, if the price gets established over this area, it could be a bullish sign and signal that a further rise is likely, potentially attracting long trade entries.
(Click on image to enlarge)
The S&P 500 Index
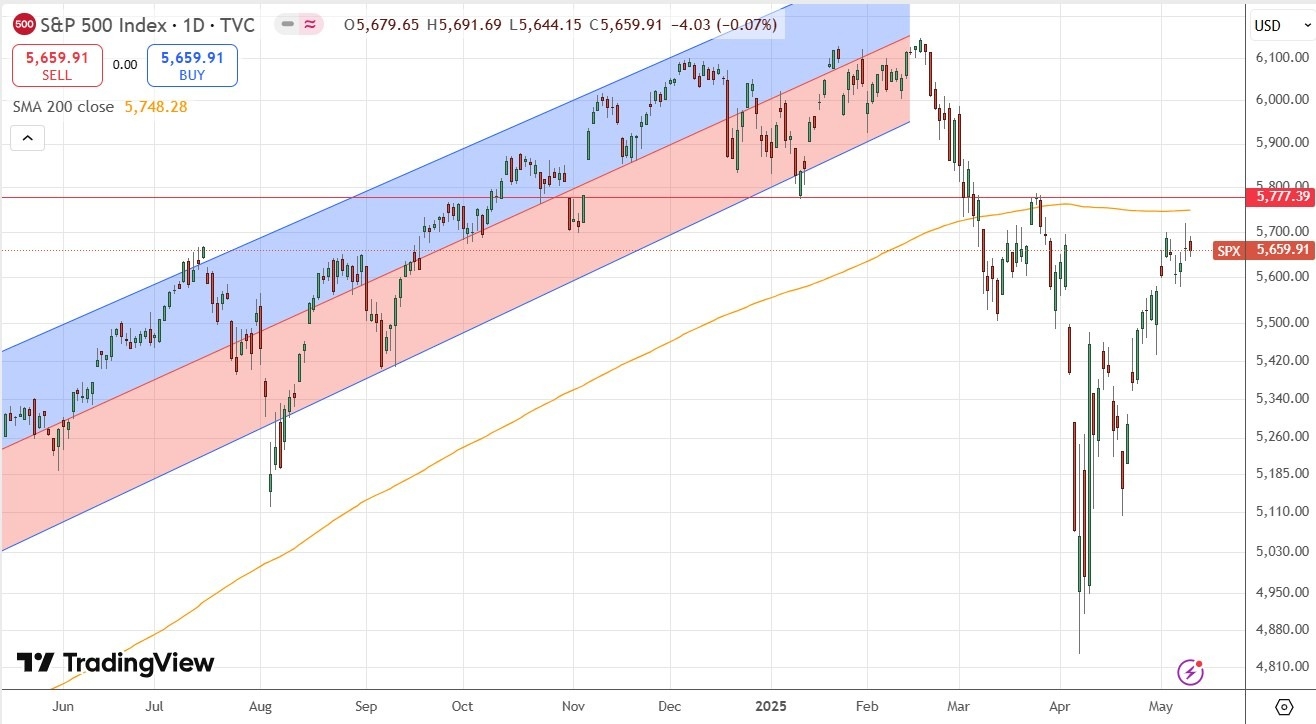
The S&P 500 Index advanced a bit again last week on improved risk sentiment, despite the stronger US dollar. There is generally positive rhetoric coming from the Trump administration about tariffs, giving the impression that much of it will be negotiated away by the July deadline, and this is pleasing stock markets and allowing minor bullish price advances.
Technically, the interesting thing here is that the price has reached a level close to the 200-day simple moving average, which is traditionally a key marker as to whether a market is bullish or bearish, with a bear market seeing the price below the average, as it is today.
Another technical factor is the horizontal resistance level at 5,777 which is confluent with the moving average, so this price area can be expected to put up some resistance.
If the price rejects this resistant area firmly, it could signal the start of another bearish downwards leg which might profitably traded short. On the other hand, if the price gets established over this area, it could be a bullish sign and signal a further rise is likely, potentially attracting long trade entries.
(Click on image to enlarge)
Gold
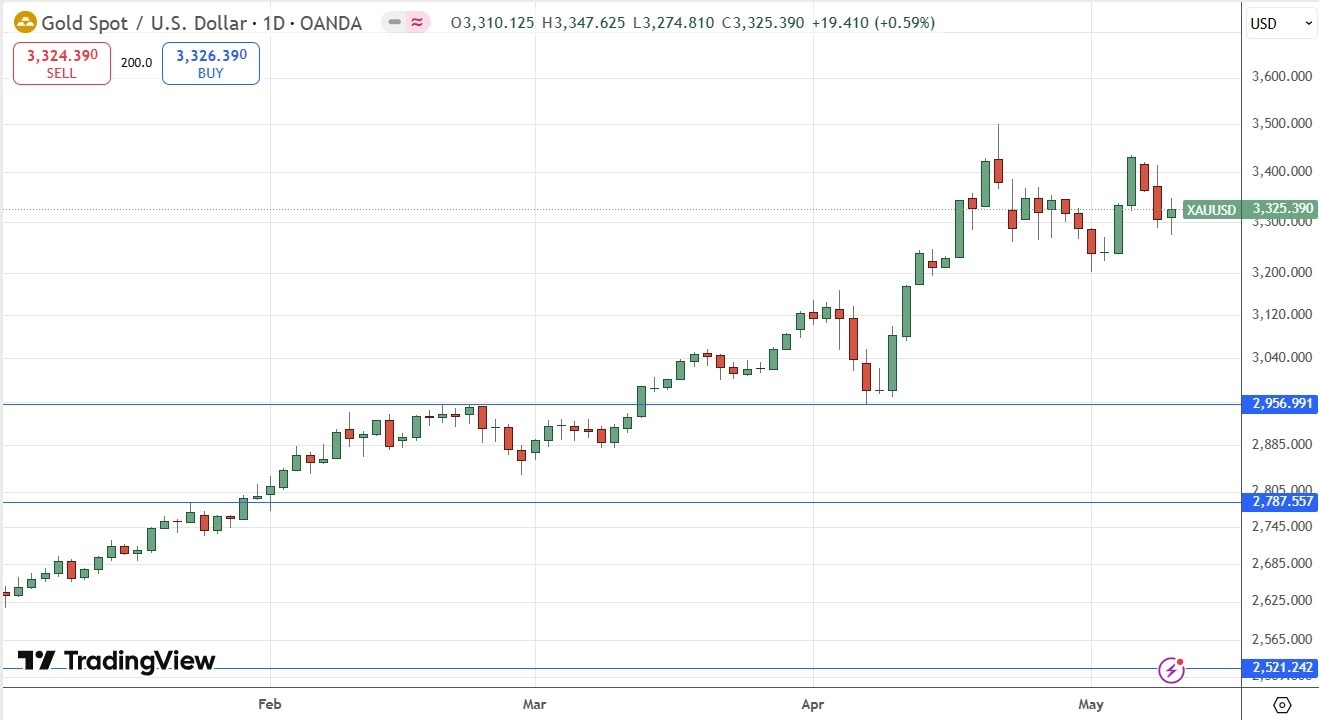
Gold reached an all-time high just three weeks ago, at a fraction below the half-number at $3,500 per ounce. It made a deep bearish retracement larger than three times the long-term average true range on the daily chart before making another attempt at the high. This second high turned out to be a lower high, and the movement seen on the price chart below is suggestive of a bearish double top just above $3,400.
Despite this bearish sign, the retracement has not been deep following this second attempt at the highs, and this bullish movement included a record high New York closing price, so traders and investors have good reasons to be long here.
So, it may be worth getting involved on the long side here, but I’d want to see a new significant high close first. Once we get a daily (New York) close above $3,431 I will be comfortable taking a new long trade.
Having said all that, there is a bearish case based on the recent price action which suggests that a strong and sustained break below $3,200 should produce a further strong bearish move which might profitably be traded short.
(Click on image to enlarge)
Bitcoin
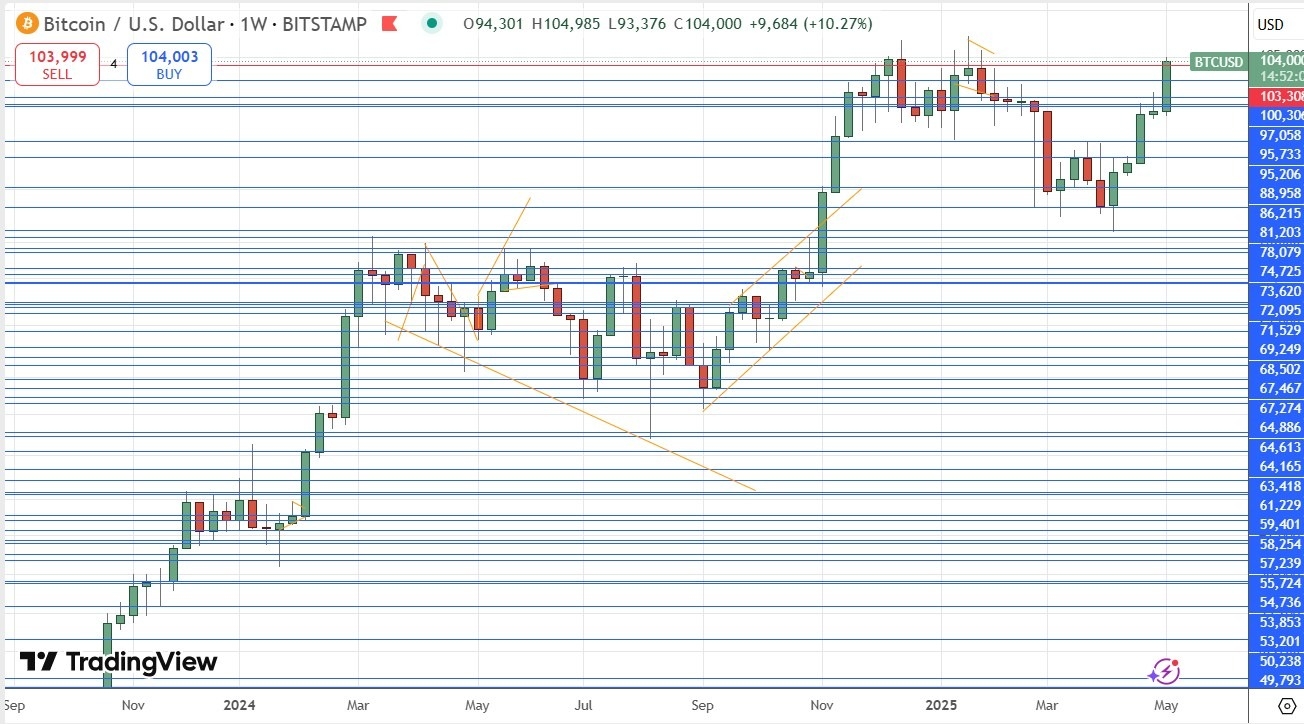
Bitcoin made a very strong bullish move over the past five days, after spending weeks declining following the rally to a new record high in December.
The gains have been strong and as Bitcoin trades on the weekend, we can see Sunday’s candlestick is strongly bullish (unusually large, closing near the top of its range, and trading well above the big, round number at $100,000), and it is threatening to close at a new record closing price. If at 5 PM New York time on Sunday the price is above $106,187, this will justify a new Long trade entry by trend and momentum traders. The price is already trading well above $104,000, so it does not have far to go.
The US Presidency is very pro-crypto, and it is becoming clear regulations will be loosened, so there are reasons for a tailwind here which can assist in a significant, new bullish breakout. I will go long tomorrow if the price ends today above the $106,187 mark.
(Click on image to enlarge)
USD/MXN
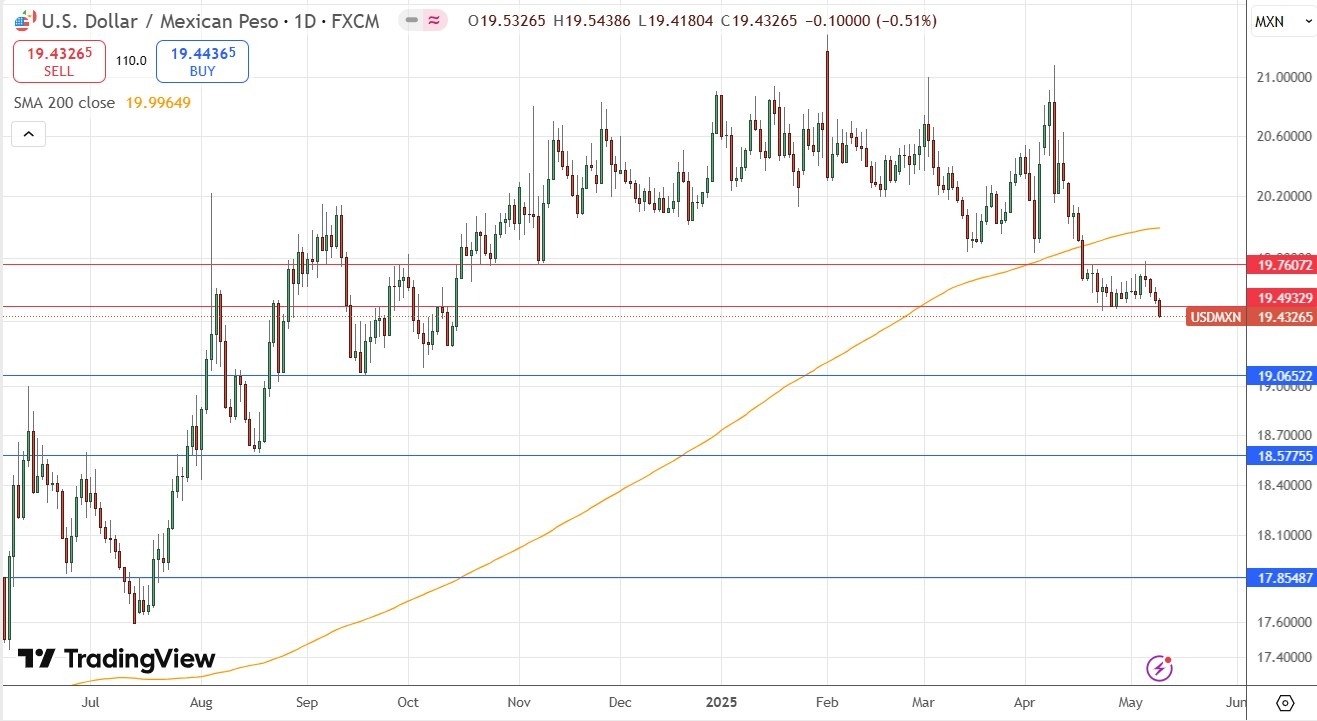
The USD/MXN currency pair has continued to look heavy as it finally broke below the key support level at $19.4933, which is confluent with the major half-number at $19.5000. I wrote last week that if the price breaks below this area, it could fall strongly and quickly. As this only happened on Friday, we are now about to find out.
Despite the greenback’s recovery over the past three weeks, the Mexican peso has been one of the very few currencies which continues to show strength against the greenback as well as standalone long-term relative strength.
The fundamental driver behind the strong Mexican peso is the way the trade war between the US and Mexico has been defused, at least until late June. I would be happy to enter a short trade when the market opens this week, targeting the support level at $19.0652.
(Click on image to enlarge)
Bottom Line
I see the best trades this week as the following:
- Long of gold following a daily (New York) close above $3,432.
- Long of Bitcoin following a daily (New York) close above $106,187.
- Short of the USD/MXN currency pair.
More By This Author:
BTC/USD Forex Signal: Bullish Breakout To 2-Month High Price
Forex Today: Fed Almost Unanimously Expected To Hold Rates Steady
Forex Today: Asian Stocks Continue Rally
Risk Disclaimer: DailyForex will not be held liable for any loss or damage resulting from reliance on the information contained within this website including market news, analysis, trading signals ...
more

