Weekly Forex Forecast - Sunday, April 28, 2024

Image Source: Pixabay
CAC
(Click on image to enlarge)
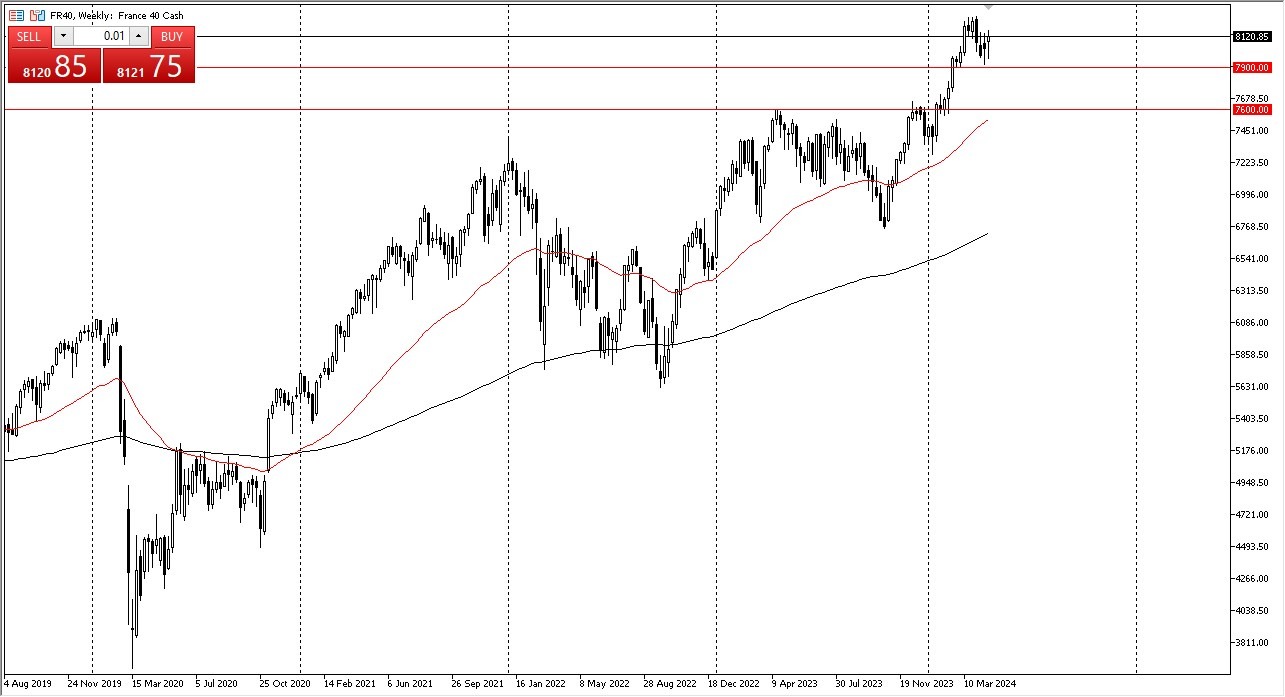
The Parisian CAC initially fell during the week, before it turned around to show signs of life. The EUR7900 level has continued to serve as a major floor, and there seem to be plenty of buyers just above that level. The question now is whether or not it can build up enough momentum to continue going higher.
It certainly looks that way, and I would not be surprised to see this market go looking to the EUR8200 level over the next several sessions. At this point, I certainly have no interest in trying to short stocks anywhere, France included.
GBP/JPY
(Click on image to enlarge)
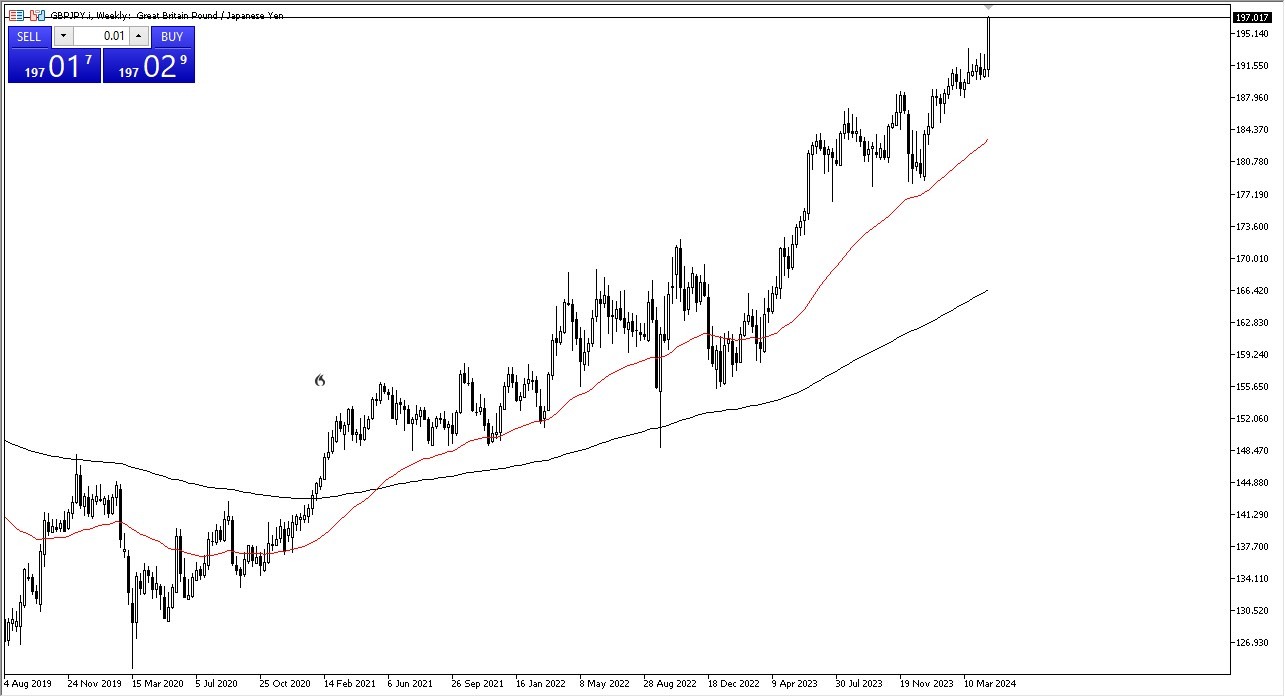
The British pound rallied rather significantly during the course of the trading week, as it recently closed near the JPY197 level. It looks like it could continue to go higher, especially now that the Bank of Japan has admitted that they can’t do much about the value of the yen.
In fact, they said the shrinking yen isn’t something that they’re worried about. That’s an interesting take, and probably a flat out lie. Nonetheless, I think we will continue to see the British pound overtake the Japanese yen.
Silver
(Click on image to enlarge)
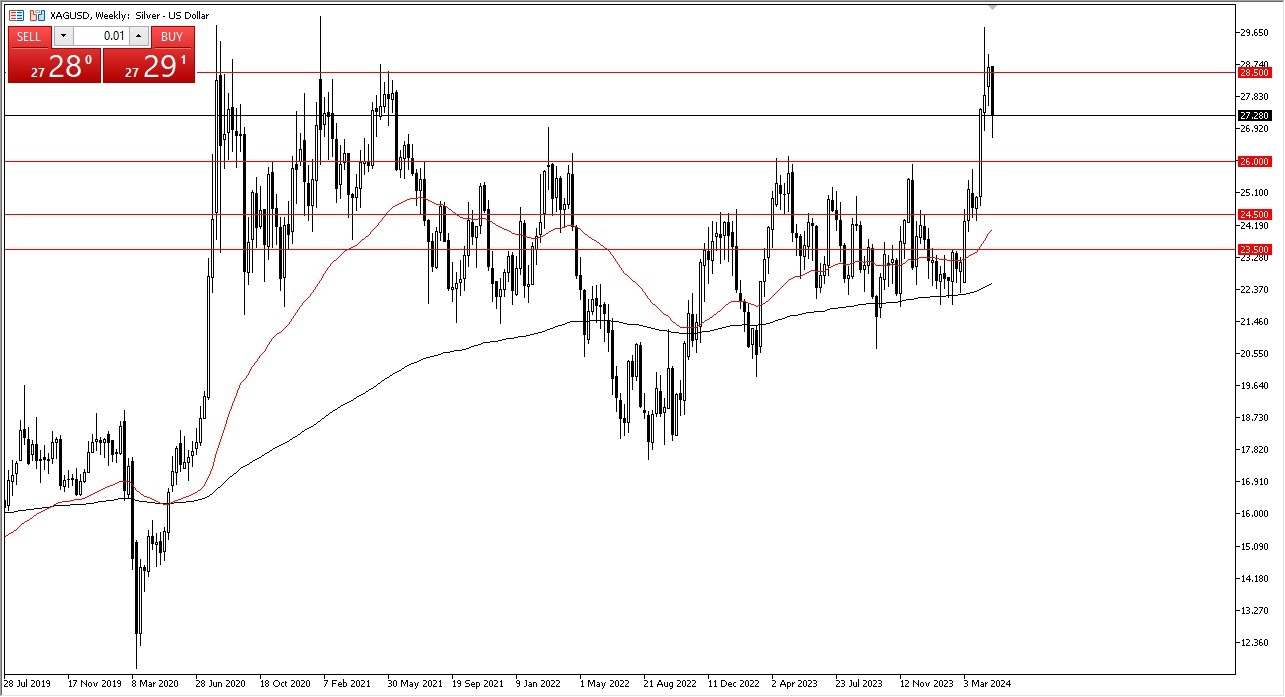
Silver witnessed a somewhat negative week, but keep in mind that the market had been straight up in the air for what seemed like a lifetime. Furthermore, it also appears to be extended, to say the least. Therefore, one should pay close attention to the $26 level underneath, because that could define whether or not the grey metal is still in an uptrend. On the upside, the $28.50 level has been offering a significant barrier, and I believe it could serve as a short-term target for those who are bullish in this market.
GBP/CHF
(Click on image to enlarge)
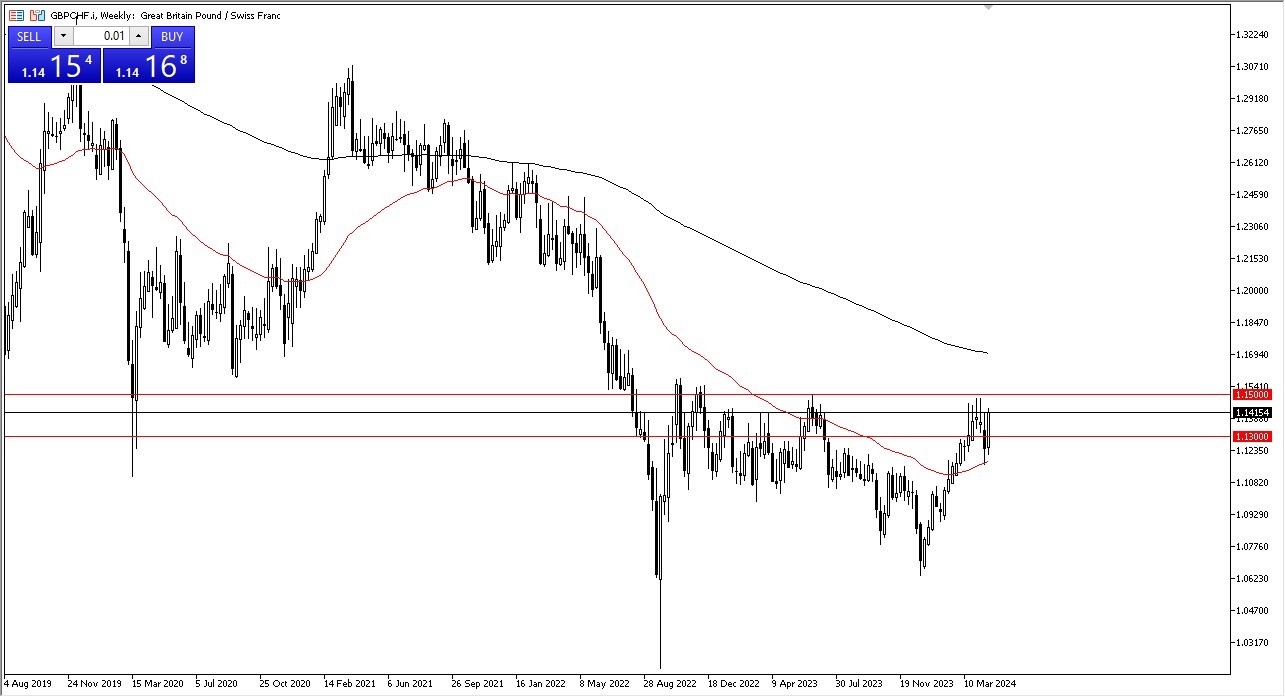
The British pound also rallied significantly against the Swiss franc during the course of the week, but the same major barrier continued to get in the way. This, of course, is the CHF1.15 level, which has been like a brick wall multiple times.
It is worth noting that the British pound has been relentless in its attempt to break out through this level, and I think it actually will, given enough time. If it can clear the CHF1.15 level on a daily close, I would then anticipate a move to the CHF1.17 level. Underneath, I see the CHF1.13 level as support.
USD/MXN
(Click on image to enlarge)
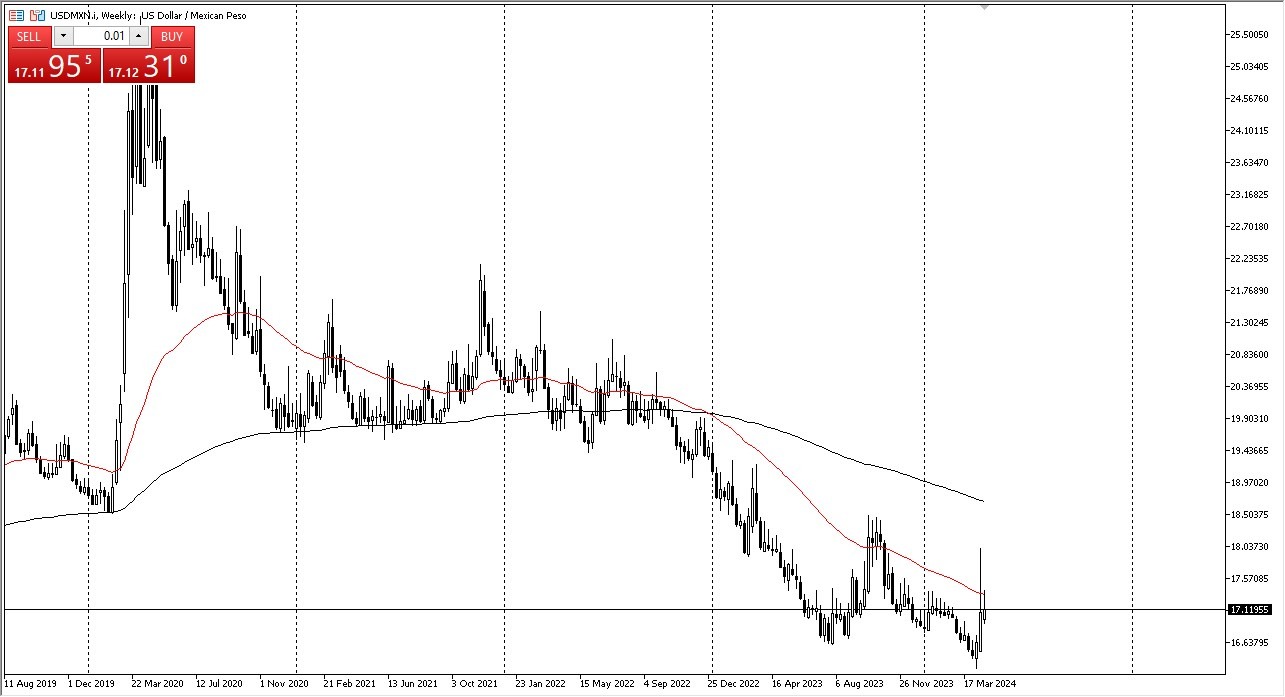
The US dollar rallied slightly against the Mexican peso during the past week, but I still see a lot of resistance above in the form of the MXN17.50 level and the 50-week EMA. It ended up forming a bit of a shooting star, so that suggests that this space will continue to see some downward pressure. After all, the interest rate differential heavily favors the Mexican peso. Therefore, if you do want to get long of the US dollar, this might not be the pair to do it in.
EUR/GBP
(Click on image to enlarge)
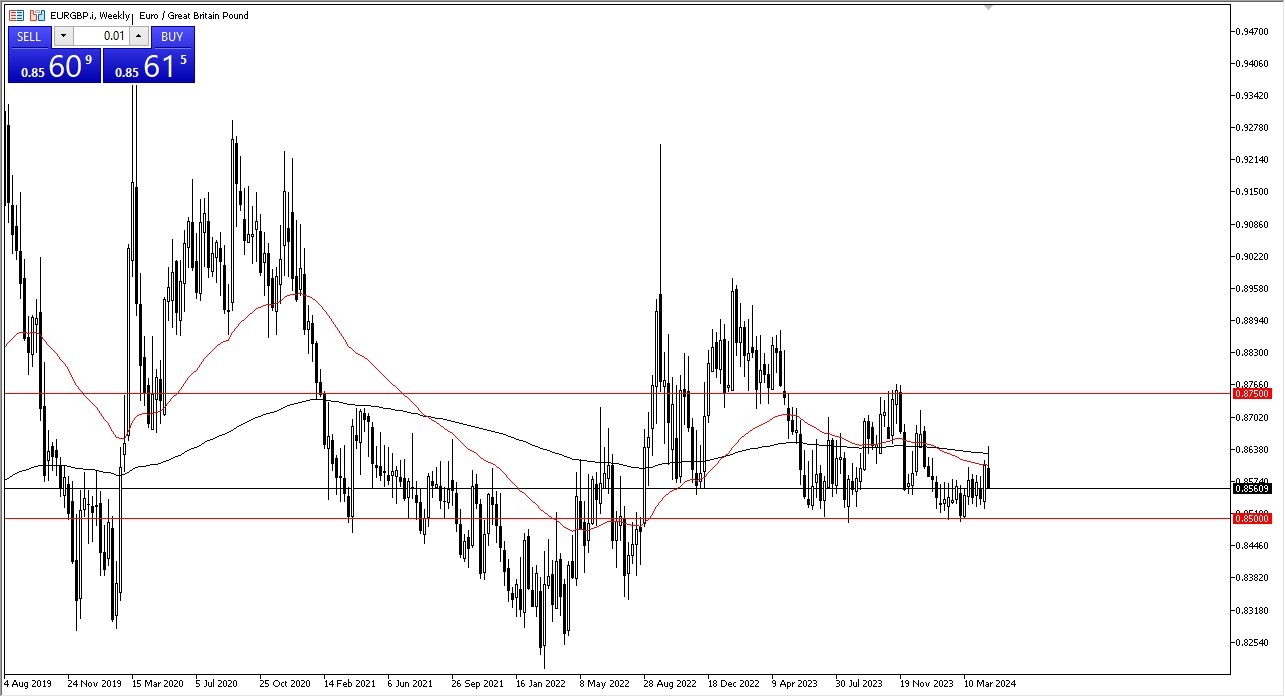
The euro initially rallied significantly during the course of the week, only to find significant resistance near the 50-week EMA and the 200-week EMA. Ultimately, this is a market that looks as if it is going to finish the week at the very lows of the candle, meaning that we see some follow-through.
However, I do believe that the 0.85 level underneath is going to continue to hold, so the closer we get to that area, the more likely I am to be looking for some type of bounce to start buying again.
Bitcoin
(Click on image to enlarge)
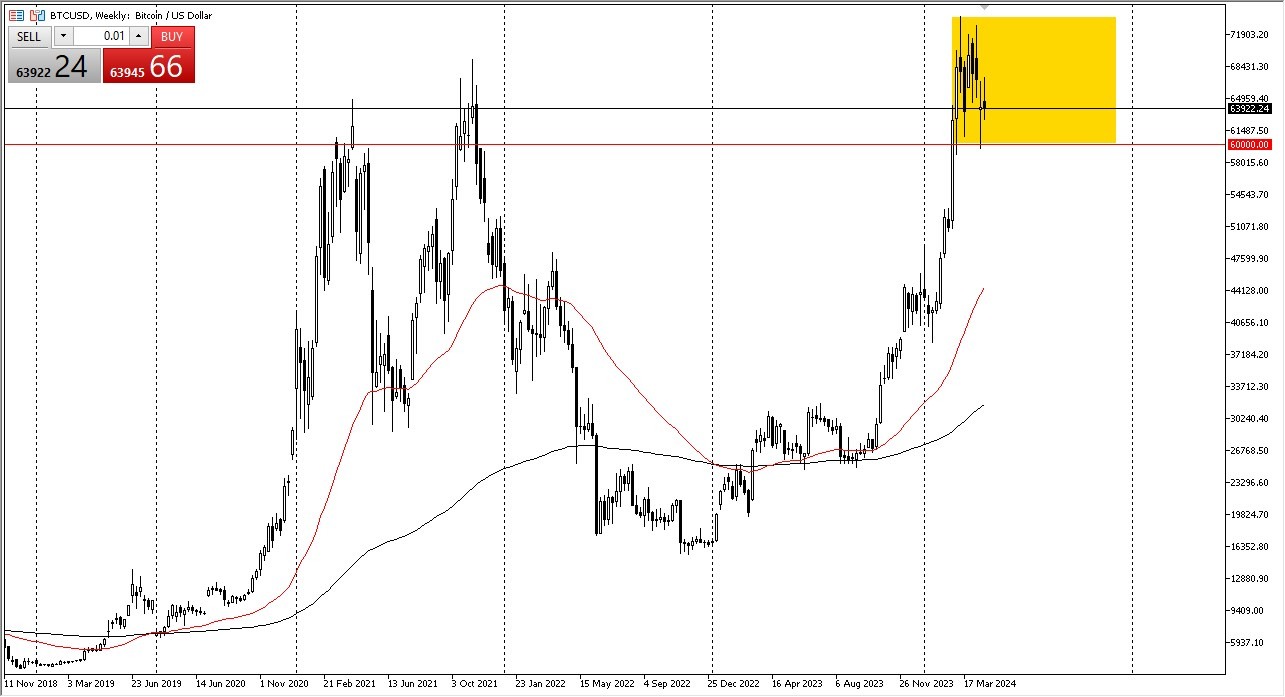
Bitcoin moved all over the place during the course of the week, essentially finishing the week slightly negative. That being said, it certainly looks as if there is a lot of support underneath, and it seems like the $60,000 level is an area that could be a massive “floor in the market” that traders will continue to use.
I think this remains a “buy on the dips” space, but I don’t think Bitcoin will see a huge run higher anytime soon. In other words, I would be looking for value and then dumping it off as soon as I get a significant profit.
EUR/USD
(Click on image to enlarge)
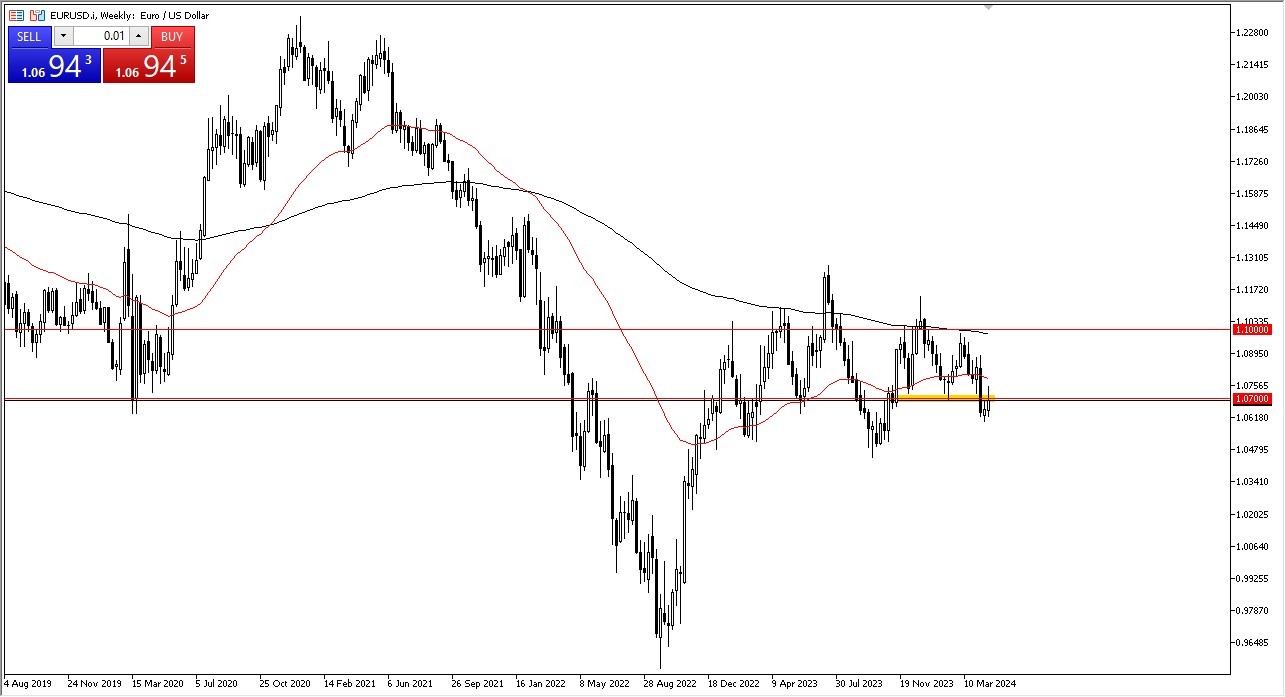
The euro initially rallied during the week, but it continued to see a lot of noise above the 1.07 level. I will continue to pay close attention to interest rates in the United States, which are seemingly stuck in a one-way trade at the moment, thereby making the US dollar stronger.
The fact that this market gave back some of the gains tells me that although it could rally next week, the upside would be limited. I am presently using this chart as a way to determine which way the US dollar could be traded against other currencies.
More By This Author:
GBP/USD Forecast: USD Strength, GBP WeaknessEUR/USD Forecast: Euro Continues To Grind A Bit Higher
EUR/USD Forecast: Rangebound and Tight
Disclaimer: DailyForex will not be held liable for any loss or damage resulting from reliance on the information contained within this website including market news, analysis, trading signals and ...
more
