We Are Dealing With A Market In Transition
Thus far in 2018, we’ve dealt with far more uncertainty injected into the market than we have seen in some time, and this week was a doozy from a new tone out of the Federal Reserve to rising talk of trade wars, never mind the shuffling of personnel around the White House.
The week started off on a seriously rough note with the Technology sector taking some serious punches as Facebook (FB) suffered its worst day in over six years, losing more than 7% as investors worried about ramifications from the possible abuse of Facebook’s user data by Cambridge Analytica. Monday also saw the U.S. Treasury selling $51 billion in 3-month bills and another $45 billing in 6-month bills. Over the past month, the Treasury has sold a record $747 billion in bills on a gross basis, the highest relative to the stock of outstanding public debt since the end of 2009 Treasury Bill issuance is at a record high relative to the size of the economy. That is a lot of investable capital being sucked up to pay for record level deficit spending outside of a recession or a war. Given the trade war saber rattling emanating from DC and China, we’re not surprised investors are flocking to this safe haven.
On Tuesday Facebook dropped hard again, as much as 12% from the prior Friday’s close, but managed to rally to close down just 2.5% on the day as Oracle (ORCL) found itself in the spotlight of investor angst, losing almost 10% on slower cloud sales guidance. The S&P 500 and the Tech sector managed to eek out a close in the green, but the Russell 2000 closed slightly in the red.
Wednesday was the first press conference for the newly appointed Federal Reserve Chair Jerome Powell and he showed that there is definitely a new monetary sheriff in town. Powell indicated that he is much less focused on the Fed’s models and projections and more on the actual data. For years, Fed officials have recited the mantra of being data-dependent, but the actions of the Fed were clearly more model-driven. For example, when unemployment reached 6.5% when the Fed did not tighten policy as it had claimed it would. While we like the focus on data versus models, in part because it’s how we roll here at Tematica; the market wasn’t too pleased as it looks like (and we expected) that Fed punchbowl is going to be drained faster than many had hoped. The major indices were down as much as 1.5% in the morning trade as investors adjusted their expectations to the more hawkish tone out of the Fed. By the way, had just one person voted differently, the Fed would have plotted a total of four hikes in 2018, so there is a very real probability of having more than three this year.
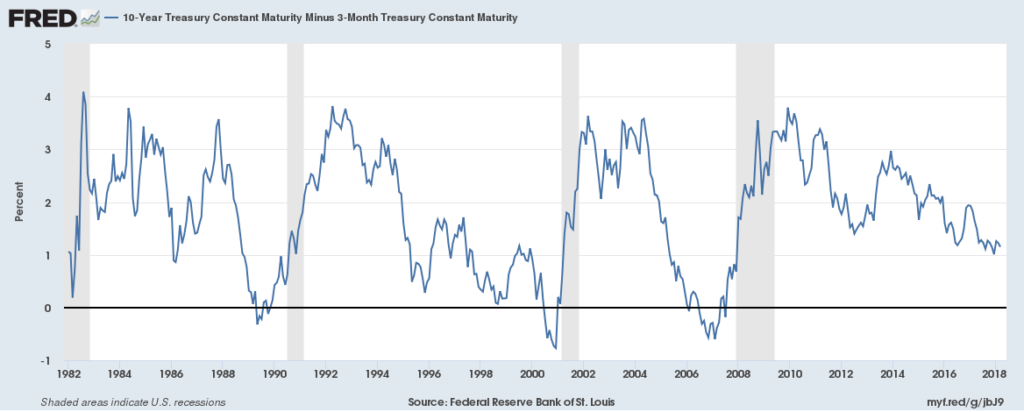
Thursday the markets opened in the red as investors' nerves were further frayed on rising concerns of a trade war. The 10-year Treasury yield experienced its biggest one-day drop in six months, falling more than 10 basis points to just under 2.8%. We are seeing a meaningful flattening in the yield curve as the difference between 10-year and 3-month has fallen to just 100 basis points. From a historical perspective, we are currently in the longest streak in history without an inverted yield curve.

The Fed’s rate hike this week is the 6th rate hike in the current business cycle and we have not yet seen the full lagged effects of the first five rate increases. At least 2 more are planned (we suspect a third is likely this year) which means a 200 basis point increase in total. We have also not seen the full effect of the roughly 100 basis point equivalent in tightening from the unwinding of the Fed’s balance sheet. Put the two together and you have effectively about 300 bps of cumulative tightening. Looking at this level of tightening relative to past rate hike cycles:
- This is twice as much tightening as was implemented prior to the 1987 stock market collapse.
- This is about as much as in 1994 when rising rates forced Orange County to declare bankruptcy and ignited the Mexican Peso crisis.
- This is more than the increases prior to the 1997 Asian Financial Crisis and the 2001 dot-com bust.
Well now, that doesn’t sound like much fun, so let’s look at what we’ve experienced during prior rate hike cycles. Post World War II there have been thirteen rate hike cycle, ten of which ended in recessions. The three that did not end in a recession, (mid-1960s, mid-1980s, and mid-1990s) all saw an average slowing of GDP of around 2%. Yep, that is right around the level of GDP growth we have today.
Is it time to sell everything, head for the hills, fill up the generator and stockpile the dehydrated food?
Not so fast. Using history as a guide, on average, one year prior to the first rate hike, real GDP sits around 3.1% and economic growth accelerates to an average of 4.2% by the time the Fed begins its tightening cycle. By the time of the last rate hike GDP growth slows to an average of 3.7%. Notice the lag.
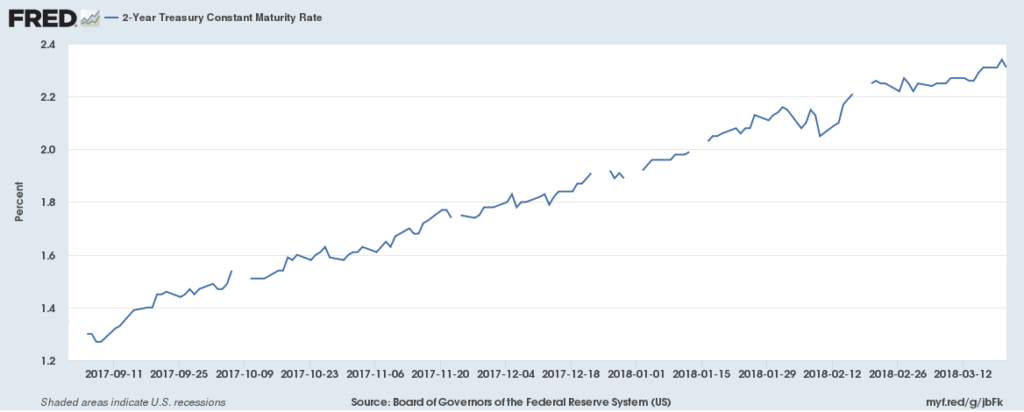
What we can learn from history is that with these rate hikes we are heading into the part of the cycle where liquidity will become an issue which means lower quality credit get hit hard and the loftier asset prices come under pressure. We can see evidence of this looking at the 2-year Treasury, which is highly liquid and hypersensitive to shifts in Federal Reserve policy. The yield on the 2-year has risen over 100 basis points since September and has overtaken the dividend yield on the S&P 500 by 45 basis points. We haven’t seen that in nearly 10 years.

Where can we look to see where we are in the process? We are watching rising subprime auto loan defaults, rising delinquencies for credit cards held at smaller banks, and the spread between investment grade and high yield corporate bonds. We are currently sitting at all-time debt-to-GDP ratio highs and the share of investment-grade bonds that are BBB-rated is up to nearly 50%. This means there is a growing risk associated with a wave of credit downgrades once the economy slows, which would force selling of bonds that are no longer investment grade. We are watching interest rates rising during a year when $1.5 trillion of investment grade credit is coming due and an additional $430 billion of high yield credit, much of the proceeds of which were used to fund share buybacks, leaving balance sheets more highly leveraged.
We are seeing economic expectations being reset. At the beginning of February, the Atlanta Fed GDPNow was 5.4% but has now fallen to 1.9%. Looking out to the rest of 2018, the potential impact of the now rising potential for real trade wars is a headwind to many sectors that will at the very least increase input costs, reducing corporate profit margins. This coming at a time when we are hearing nonstop about the tight labor market, which is also expected to put upward pressure on labor costs, which will also reduce corporate profit margins.
The bottom line is that in 2017 the market was very focused on hearing only what it wanted to hear and to be fair, the economic data coming in was mostly positive as were the actions coming out of Washington D.C. But as we are seeing, 2018 is no 2017. We are witnessing a market in transition. That synchronized global expansion is rolling over. The VIX, the volatility index, this year is on average 50% higher than it was last year. The last time this happened was 2008. Looking at the past, in periods where the VIX is low and declining, the bull market is intact. When it rises and sets new and higher ranges, it means we are in transition and so we are. As I said above the easy money liquidity punchbowl is being drained. All that liquidity that had been pushing asset prices higher is being sucked out of the system and in its wake, we have record high levels of debt across a broad range of the U.S. economy and the globe. This is the time for quality balance sheets, better earnings visibility and an active eye on the evolving data.
Disclosure: None.


