Was There Ever A ‘Skills Mismatch’? Notable Differences In Job Openings Suggest No
Perhaps the most encouraging data produced by the BLS has been within its JOLTS figures, those of Job Openings. It is one data series that policymakers watch closely and one which they purportedly value more than most. While the unemployment and participation rates can be caught up in structural labor issues (heroin and retirees), Job Openings are related to the demand for labor rather than the complications on the labor supply side.
It has been the surge of Job Openings since January 2014 that has been both misleading and comforting for economists and monetary authorities. This robust trend that suddenly appeared out of nowhere seemed to confirm economic acceleration that really wasn’t there, and in the years since they were fooled by it (and other data) policymakers in particular have used it to justify their so-called skills mismatch explanation for why they got 2014 so wrong.
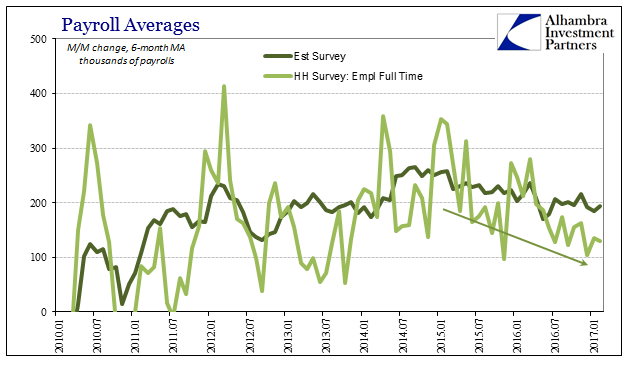
But even the Job Openings estimates have struggled to gain of late. Since around April 2015, the monthly rate has more or less plateaued. That would seem consistent with the unemployment rate as well as any “skills mismatch” which proposes the end of “slack.” However, with absolutely no acceleration in wages and earnings, it is a difficult if not impossible position to defend. Instead, other BLS data points to widespread deceleration perfectly consistent with other economic accounts (including GDP).


The BLS is not the only organization that produces estimates for labor demand. The Conference Board has since May 2005 constructed an index of online Help Wanted Ads (HWOL). Taken from a survey of 16,000 online job sources, with duplicate listings removed, this measure of job openings has indicated in absolute terms more of a robust labor market recovery, but with a far smaller contraction during the Great “Recession.”

It is difficult not to notice the differences, however, especially the huge decline in online help wanted ads after November 2015. That is not the only disparity, as when viewed from the perspective of rates of change the divergence really dates back to early 2014:

The JOLTS version of Job Openings completely and by itself surged while the Conference Board’s clearly did not. Several explanations have been proposed for the split, most of which revolve around Craigslist. Because the online listing site charged nothing for ads including Help Wanted ads (outside of New York and LA metro areas), it grew to become the largest source of online employment listings. It began to charge for listings in other metro areas as soon as 2007 and 2008, expanding those charges to a wider variety of cities in 2012, 2013, 2014, and 2015. For some metro areas, the fees were almost doubled at the end of 2015.
It is certainly a plausible explanation and very likely a valid one – though just as likely incomplete. In my view, the difference between JOLTS and HWOL is as much a combination as just Craigslist pricing alone. In other words, the year-over-year change for HWOL (Total Ads as well as the separate data series that includes only new online Help Wanted Ads) matches very well (too well to ignore) the trend of other economic statistics, especially those related to consumer spending (like retail sales) and goods (manufacturing).


The comparison to durable goods shown above suggests the Craigslist changes are more plausible for the radical declines in online listings in 2016 and so far in 2017 through January (Help Wanted ads online dropped significantly in January 2017 in every single metro area and in all 50 states). It also suggests that the huge increase in JOLTS Job Openings might have been severely overstating the economic improvement in 2014 (a charge I have maintained in relation to all BLS data since 2014).
If that is the case, and I believe it is as there is a close correlation between HWOL and far more than durable goods, then the Fed’s “skills mismatch” theory really starts to unravel. There is no clear standard for evaluating just how much the labor market might have slowed after 2014 during all that “global turmoil”, but more importantly there is more consistent evidence that heroin addicts and Baby Boomers weren’t the cause of QE’s ineffectiveness. The apparent amount of demand for labor during especially 2014 wasn’t nearly so robust at least from the view of the Conference Board data that unlike the BLS data is corroborated in very broad fashion. (NOTE: the Conference Board is evaluating its methodology based on the “recent” decline that it says, “may not reflect broader trends in the U.S. labor market.” While we don’t know what that might mean in terms of adjusting their data, it seems more likely related to the results after November 2015 than those of our focus during 2014).
Unfortunately for the clear effects of the latest Craigslist pricing change, we can’t determine just how much the labor market (purely from the demand side) might have been affected by the “rising dollar.” It seems all but certain that it was and quite significantly given the behavior in JOLTS after April 2015. Though we may not be able to unpack a more exact answer for recent months, overall there is still another reasonable basis here to suggest policymakers have no idea what has happened, let alone why.
Disclosure: This material has been distributed fo or informational purposes only. It is the opinion of the author and should not be considered as investment advice or a recommendation of any ...
more


