
(Click on image to enlarge)
The distribution of wealth is an important measure of the economic power of each generation.
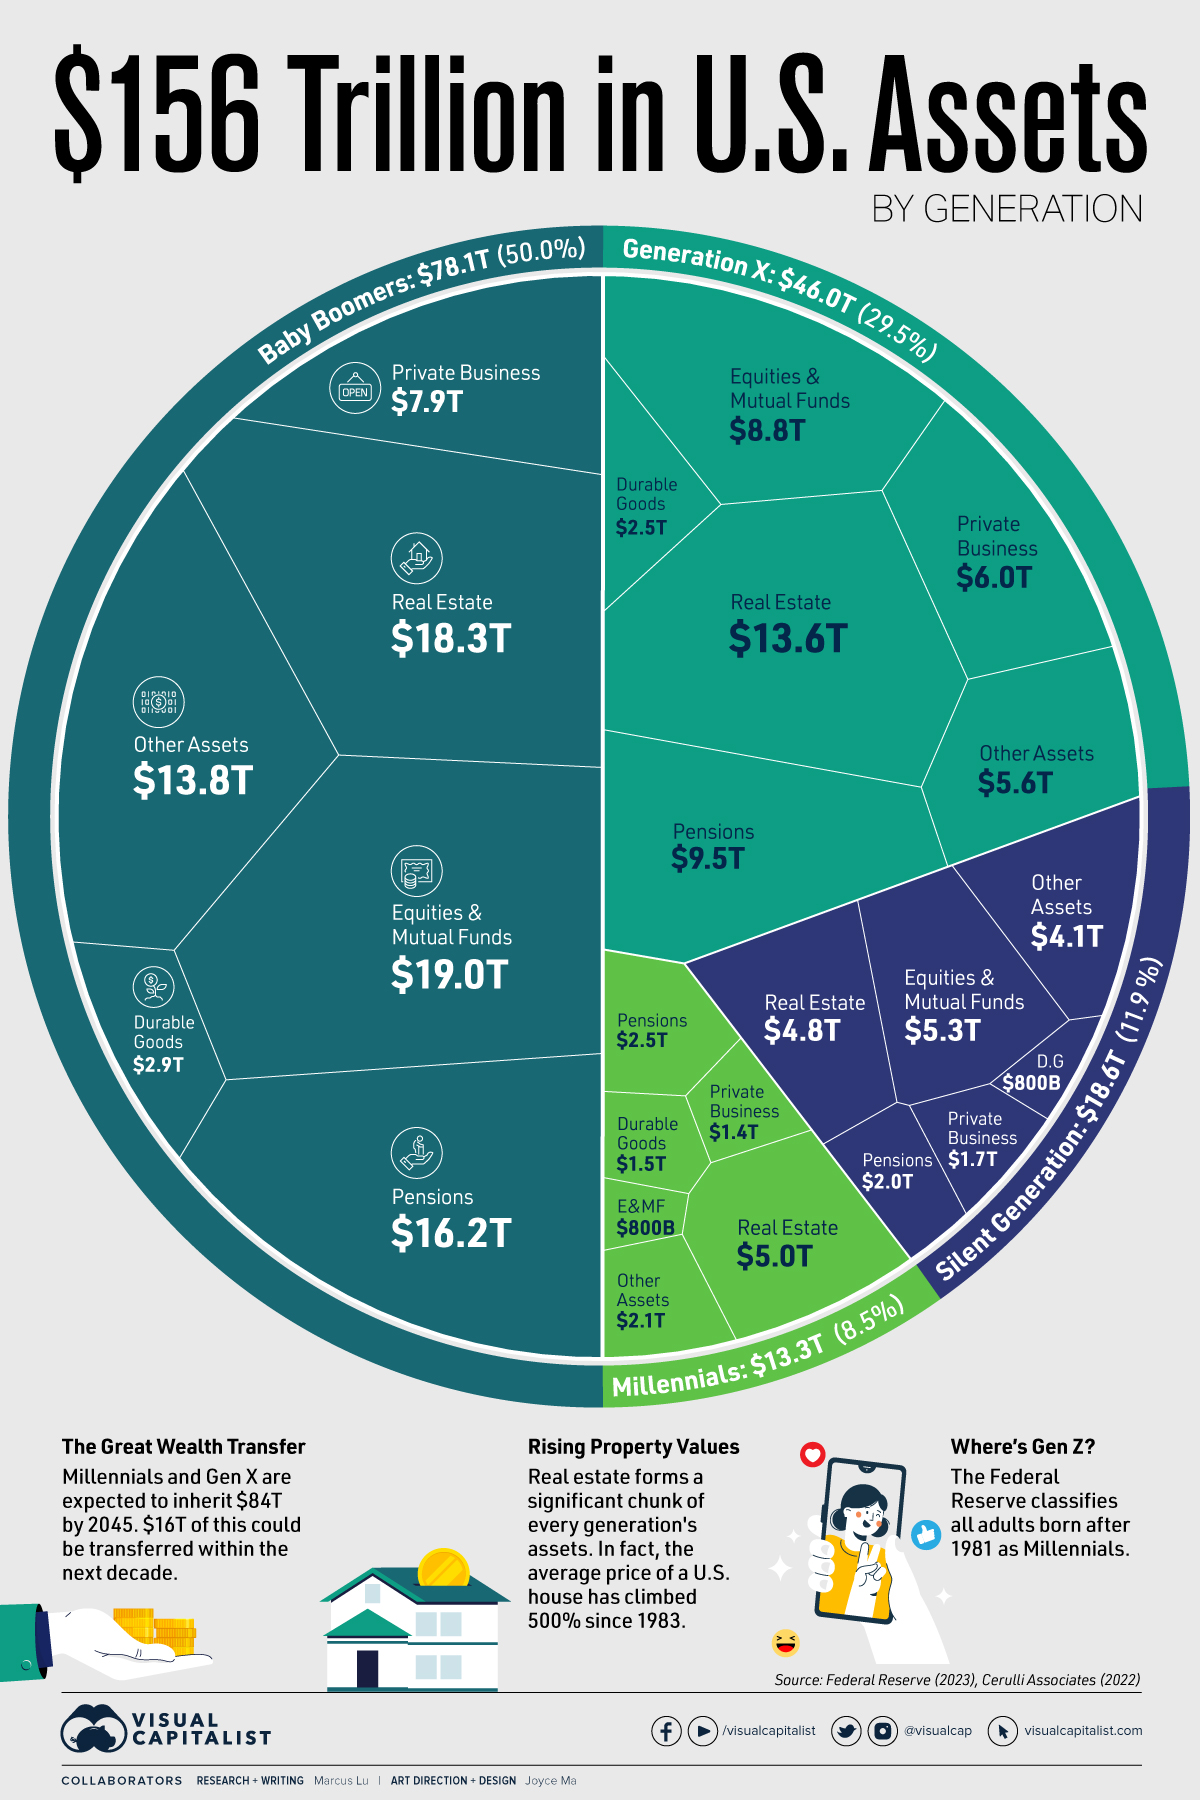
In the U.S., for example, baby boomers own half of the nation’s $156 trillion in assets despite making up 21% of the country’s population.
To learn more about U.S. wealth by generation, we’ve created two visualizations using Q4 2022 data from the Federal Reserve that break down both the assets and liabilities held by each American generation.
Assets by Generation
Assets by generation are listed in the table below. All figures are as of Q4 2022 and in USD trillions.
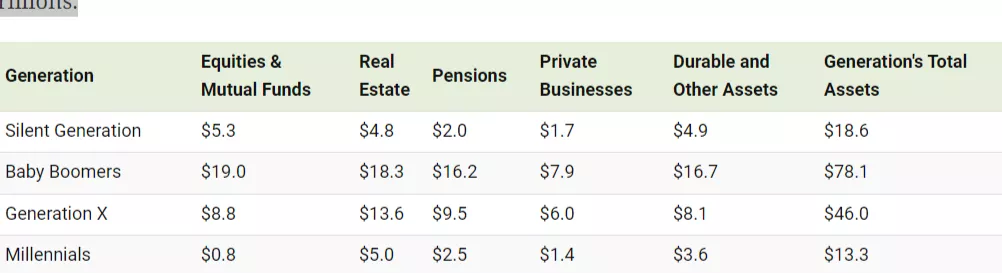
Baby boomers’ biggest category of assets is Equities & Mutual Funds, where they own 56% of the national total. Millennials, on the other hand, represent just 2%.
Where millennials do have more wealth is Real Estate, with 12% of the national total. This suggests that millennials have, for the most part, foregone investing in financial assets in order to purchase a home.
Liabilities by Generation
The following charts show a breakdown of liabilities by generation. Not surprisingly, Mortgages make up the largest component of liabilities for all generations.
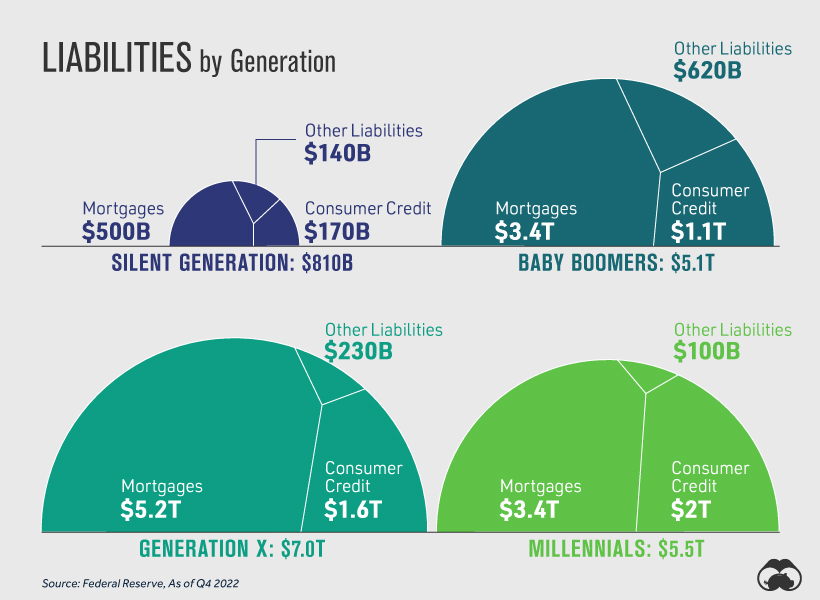
Something to highlight is that millennials are carrying the largest amount of Consumer Credit, at $2 trillion (representing about 43% of total consumer credit). As of 2022, millennials accounted for 22% of the U.S. population.
U.S. Wealth by Generation
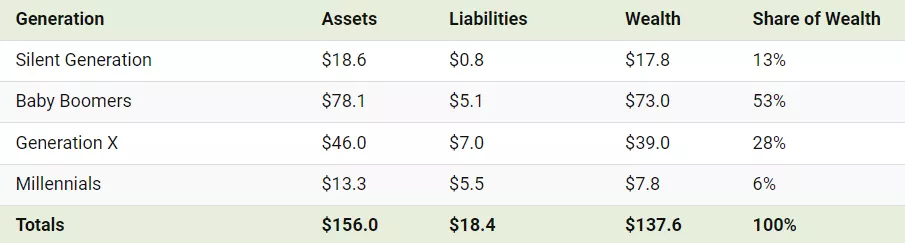
Finally, we subtract liabilities from assets to arrive at total wealth by generation in the United States. Figures again are USD and in trillions.
As a final note, it’s worth highlighting that Gen Z is still too young to be included as a separate demographic in datasets like these. Born between 1997 and 2012, these individuals are currently between 11 and 26 years old. Interestingly, the Federal Reserve currently considers all U.S. adults born after 1981 as millennials.
More By This Author:
Charted: The Rise And Fall Of WeWorkTiming The Market: Why It’s So Hard, In One Chart
The Frequency of Billion-Dollar Disasters in the U.S.


Comments
Log in or sign up to join the conversation.