
(Click on image to enlarge)
The U.S. has the highest number of billionaires, centi-millionaires, and millionaires in the world, and the distribution of wealth in the U.S. has been a topic of debate for decades.
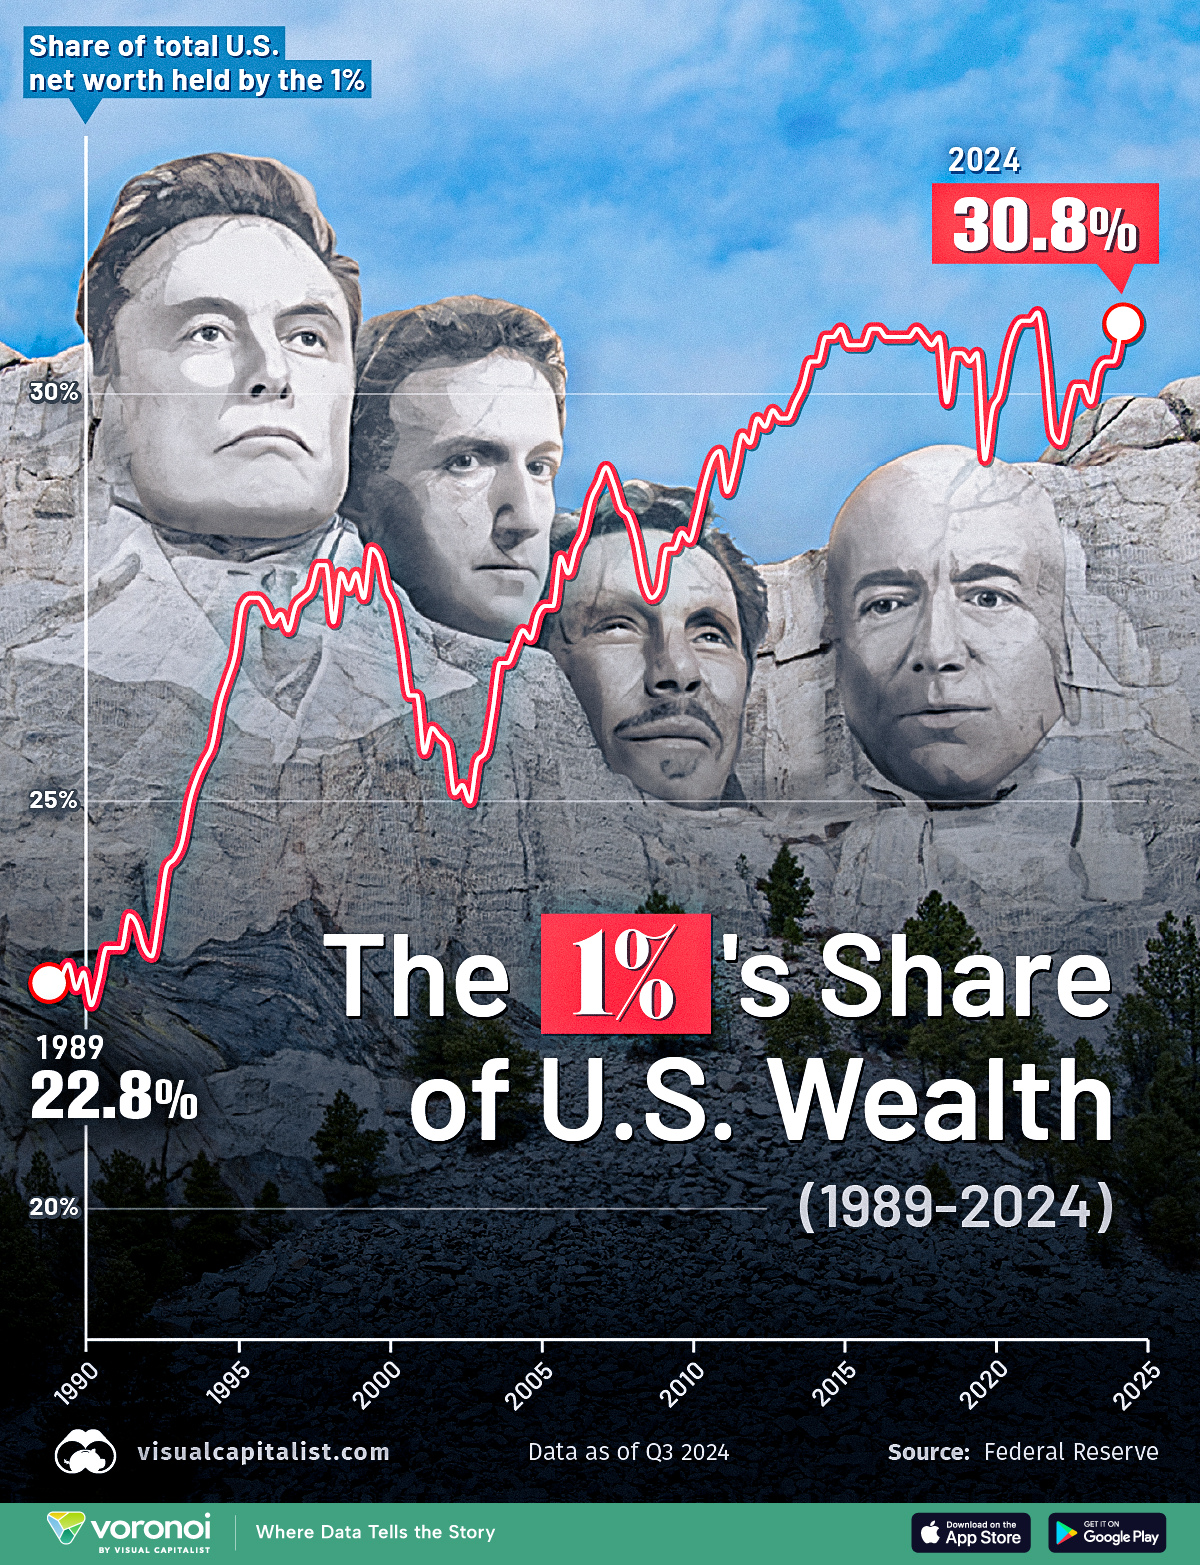
In this visualization, we outline the share of total U.S. net worth held by the top 1% of wealth holders (99th to 100th wealth percentiles) from 1989 to 2024, based on data from the Federal Reserve Economic Data (FRED) platform.
The Rising Wealth Share of the Top 1%
Over the last 35 years, the wealthiest 1% of Americans have significantly increased their share of the country’s net worth, as shown in the data table below.
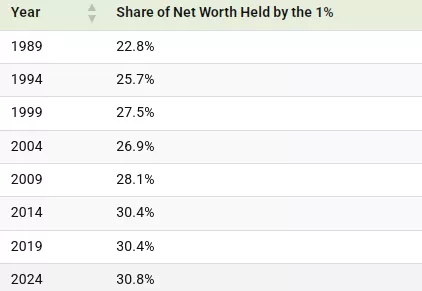
In 1989, the top 1% held 22.8% of total U.S. net worth. As of 2024, this share has surged to 30.8%. Although this figure has hovered close to 30% over the last decade, the overall rise underscores the growing concentration of wealth at the very top.
A deeper look into the data reveals that the top 0.1%—the ultra-wealthy segment—accounts for 13.8% of the total net worth. The remaining 0.9% within the top 1% holds 17%.
In dollar amounts, the top 1% held a staggering $49.2 trillion of wealth in 2024.
The Growing Divide in U.S. Income Distribution
While the top 1% has expanded its grip on wealth, the bottom 50% (1st to 50th wealth percentiles) has seen its share shrink.
In 1989, the bottom 50% held 3.5% of total U.S. net worth. Today, that figure has dropped to just 2.8%, reflecting widening wealth inequality within the country.
This data is reinforced by the U.S. GINI Index score, which measures the extent of deviation from a perfectly equal wealth distribution, with a higher number indicating greater inequality. Between 1979 and 2022, the country’s Gini coefficient increased from 34.8 to 41.3.
More By This Author:
Visualizing Asia’s $40 Trillion Economy
Ranked: Google’s Thirstiest Data Centers
Mapped: The Top Import Partner Of Every U.S. State


Comments
Log in or sign up to join the conversation.