

Yen. Image Source: Pixabay
The USD/JPY has reclaimed the 151.00 handle heading into Thursday's market session after the US Dollar (USD) notched in a third straight green candle as the Yen (JPY) continues to slump against the broader market.
The Japanese Yen has continued to decline against its major counterparties with little else to do but go down as a hyper-dovish Bank of Japan (BoJ) hangs the Yen out to dry, though investors will begin to gnaw on the possibility of the BoJ intervening in currency markets to try and defend the beleaguered Yen.
The 150.00-and-above region has historically been a popular exchange level has been a popular intervention zone for the BoJ in the past.
Japan trade balance figures will print early during the Thursday Asia market session, and Japan's Current Account (non-seasonally-adjusted) for September is expected to increase from JPY 2.279 trillion to 3 trillion.
Japan Bank lending for the year into October is also expected to tick down from 2.9% to 2.8% as Japanese banks struggle to find people to lend to despite rock-bottom rates artificially suppressed into the basement and hyper-easy monetary policy that renders funding costs functionally zero.
USD/JPY Technical Outlook
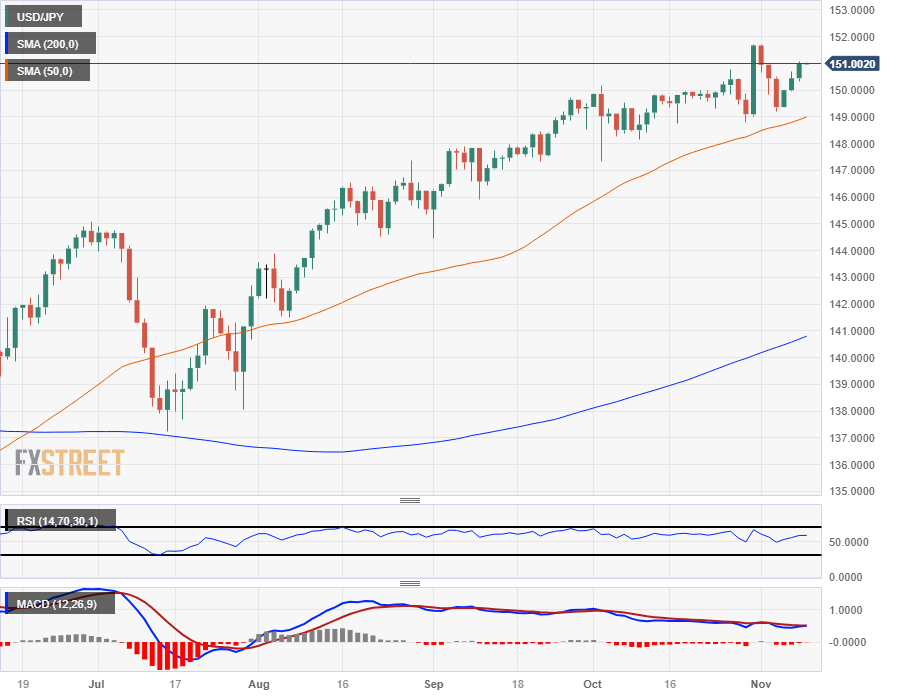
There's little topside technical resistance of note for the USD/JPY except for last week's early jump towards 152.00 that saw the pair quickly tumble back to 149.00, but the next meaningful technical barrier sits at 2022's late swing high that fell just short of claiming 152.00 thirteen months ago.
The 50-day Simple Moving Average (SMA) has struggled to catch up to daily candlesticks, currently rising into 149.00, and long-term technical support is sitting far below current price action with the 200-day SMA rising into 141.00.
USD/JPY Daily Chart
(Click on image to enlarge)
USD/JPY Technical Levels
USD/JPY
| OVERVIEW | |
|---|---|
| Today last price | 150.99 |
| Today Daily Change | 0.55 |
| Today Daily Change % | 0.37 |
| Today daily open | 150.44 |
| TRENDS | |
|---|---|
| Daily SMA20 | 149.97 |
| Daily SMA50 | 148.8 |
| Daily SMA100 | 145.92 |
| Daily SMA200 | 140.58 |
| LEVELS | |
|---|---|
| Previous Daily High | 150.69 |
| Previous Daily Low | 149.94 |
| Previous Weekly High | 151.72 |
| Previous Weekly Low | 148.81 |
| Previous Monthly High | 151.72 |
| Previous Monthly Low | 147.32 |
| Daily Fibonacci 38.2% | 150.4 |
| Daily Fibonacci 61.8% | 150.23 |
| Daily Pivot Point S1 | 150.02 |
| Daily Pivot Point S2 | 149.6 |
| Daily Pivot Point S3 | 149.27 |
| Daily Pivot Point R1 | 150.78 |
| Daily Pivot Point R2 | 151.12 |
| Daily Pivot Point R3 | 151.54 |
More By This Author:
Oil Sinks As China Outlook Turns BadUber Misses Analyst Expectations For Q3 Sales – Offers Upbeat Guidance
AUD/USD Moves Downward After RBA Dovish Statement, Trades Lower Around 0.6420


Comments
Log in or sign up to join the conversation.