
USD/JPY has fallen close to the August 5 lows and bounced. It is forming a large, bullish Hammer Japanese candlestick pattern on the 4-hour chart – if the current period ends with the pattern intact it could signal the start of a substantial pull-back or correction higher.
USD/JPY 4-hour Chart
(Click on image to enlarge)
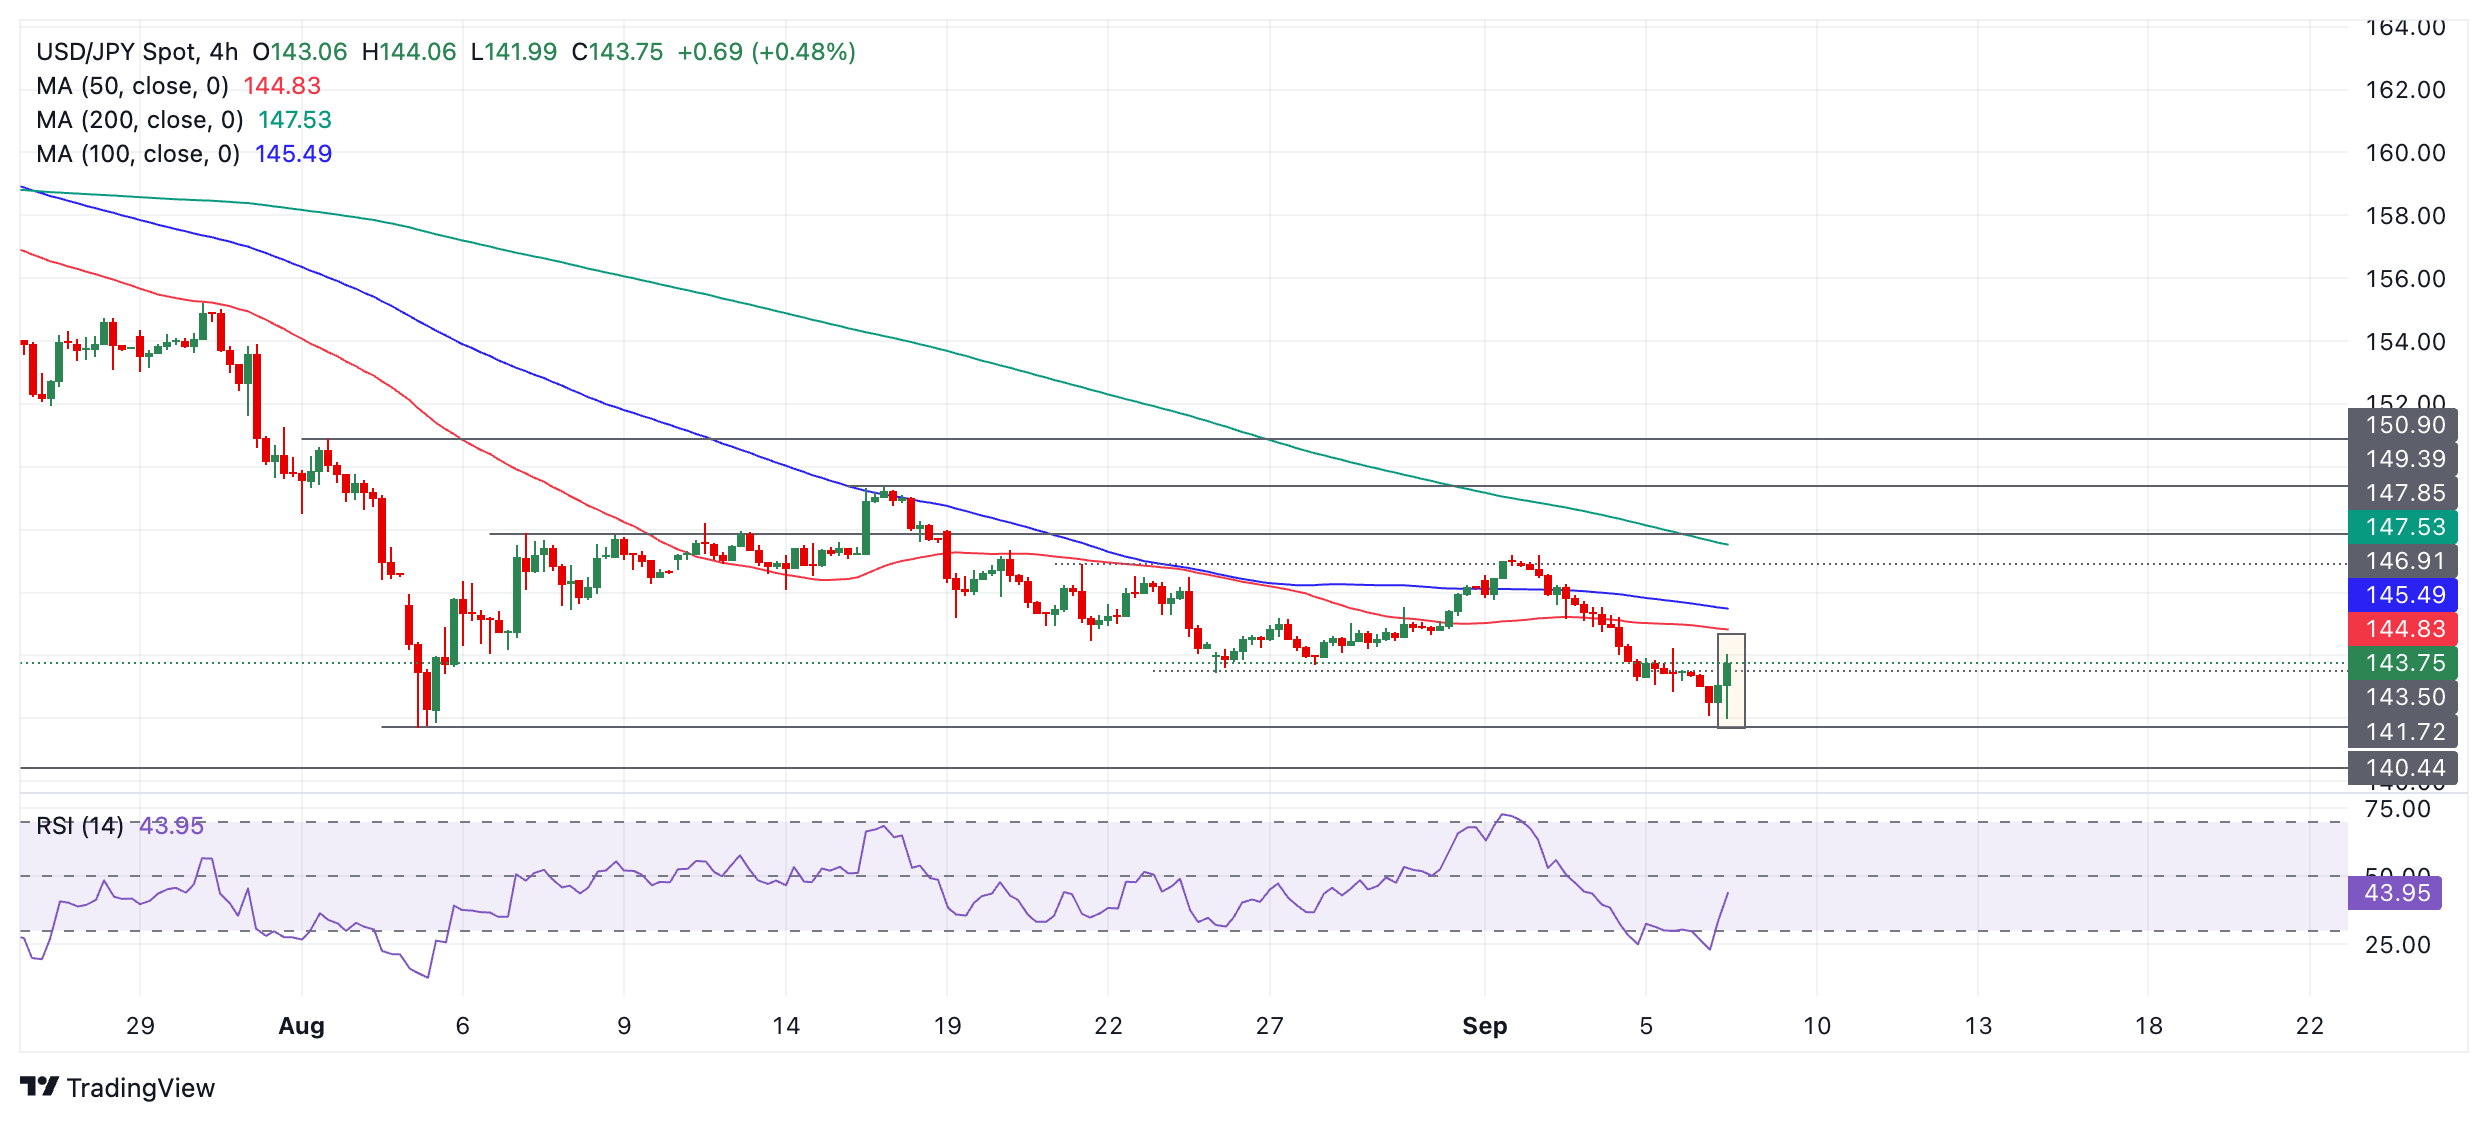
The Relative Strength Index (RSI) momentum indicator has exited oversold, giving a buy signal and indicating a greater chance of a counter-trend correction evolving. The RSI has also itself formed a double bottom pattern when looking at the previous time it was oversold on September 4. This is further evidence strengthening the case for a bullish reaction.
The short-term trend remains down, however, and it is too early to be sure that the pair is reversing the trend fully. The correction higher could soon run out of steam, leading the pair to recapitulate and start falling in line with the trend. It is a major tenet of technical analysis that “the trend is your friend” and the odds favor a continuation lower.
However, it would require a break below the August 5 lows at 141.69 to confirm a continuation lower. Such a move would probably then fall to support at 140.44 initially, the December 2023 lows.
More By This Author:
Australian Dollar Adds Gains On RBA's Hawkish StanceUS Dollar Declines On Mixed US Data
WTI Price Forecast: Sticks To Modest Recovery Gains Above $69.00, Not Out Of The Woods Yet


Comments
Log in or sign up to join the conversation.