
USD/JPY breaks clearly above the 147.24 October 3 high on an intraday basis which suggests a continuation of the short-term uptrend with a tentative target at 149.40, the August 15 high.
USD/JPY Daily Chart
(Click on image to enlarge)
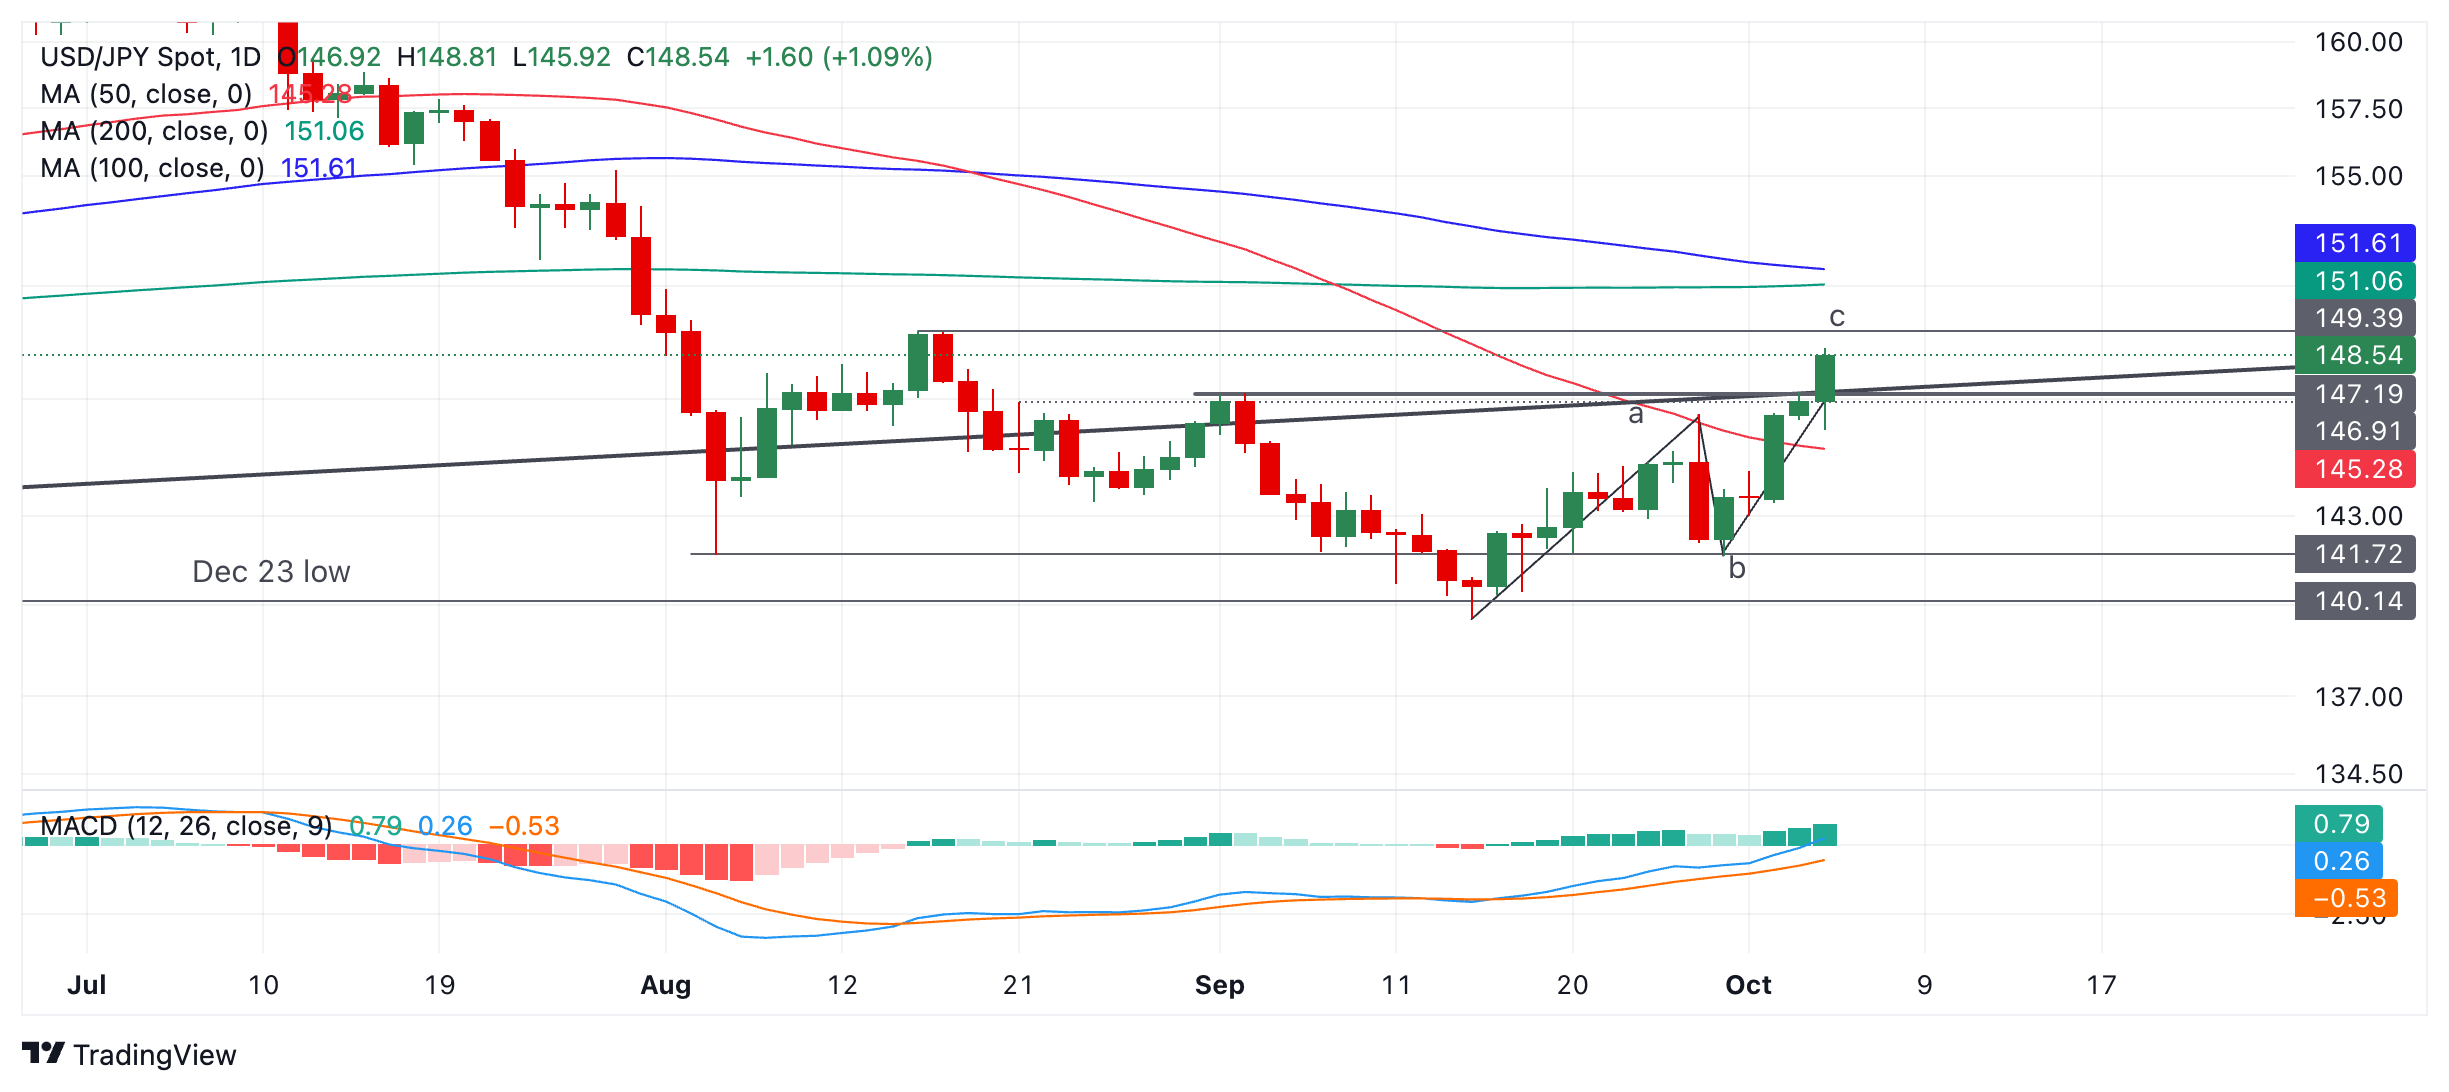
The strong bullish momentum since the August bottom, as measured by the Moving Average Convergence Divergence (MACD) indicator could indicate the start of a new, longer uptrending move.
In addition, the robust recovery from the December ‘23 and September lows – which has taken price back above the major trendline for two days and the key September 2 highs – is further evidence of bullishness.
Alternatively, the pair might also look like it is close to completing an “abc” three-wave corrective pattern of the down move that began after prices rolled over following the July peak.
A close below the 50-day Simple Moving Average (SMA) at 145.24 would probably indicate a resumption of the medium-term downtrend from the summer. Such a move would be expected to reach the wave B lows at around 141.72.
More By This Author:
Silver Price Analysis: XAG/USD Holds Above $32.00 Mark, Seems Poised To Appreciate FurtherUSD/JPY Consolidates Below 147.00, Awaits US NFP Report Before The Next Leg Up
GBP/USD Hammered Down To Over Two-Week Low, Below Mid-1.3100s On Bailey's Dovish Remarks


Comments
Log in or sign up to join the conversation.