USD/JPY Price Analysis: Yen Slips Amid Missed Inflation
The USD/JPY price analysis shows a retreating yen after data revealed softer-than-expected inflation in Japan. Meanwhile, the dollar was on the front foot after Trump confirmed the implementation of tariffs on Canada and Mexico.
Data on Friday showed cooler inflation in Japan in January. Core consumer prices in Tokyo increased by 2.2%, missing forecasts of 2.3%. At the same time, this dropped from the previous month when it increased by 2.5%. As a result, the yen paused its recent Trump-driven rally. Nevertheless, inflation remains above the Bank of Japan’s target. Therefore, it will motivate policymakers to implement more rate hikes.
BoJ rate hike expectations and safe-haven demand have propelled the yen in February. Market participants are more optimistic about Japan’s economy, which has supported rate hike bets. Meanwhile, uncertainty about Trump’s policy plans has pushed investors to buy the safe-haven yen.
However, on Thursday, Trump confirmed tariffs on Canada and Mexico would take effect in March. As a result, the dollar rebounded against most of its peers. However, it barely gained against the yen, which also got support from safe-haven inflows.
Market participants are now looking forward to inflation figures from the US, which will shape the outlook for Fed rate cuts.
USD/JPY key events today
- US core PCE price index m/m
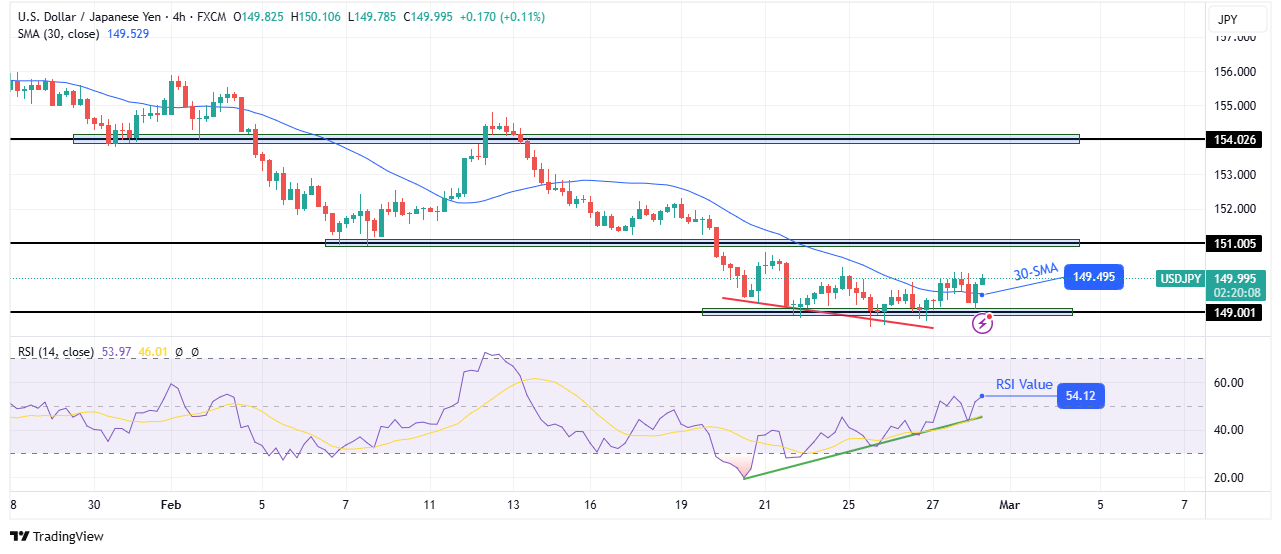
USD/JPY technical price analysis: Bullish RSI divergence leads to SMA break
(Click on image to enlarge)

USD/JPY 4-hour chart
On the technical side, the USD/JPY price has broken above the 30-SMA to indicate a bullish shift in sentiment. However, the price has not made a strong enough move to indicate a trend reversal. Meanwhile, the RSI has broken above 50, indicating stronger bullish momentum.
The previous downtrend showed weakness when it paused near the 149.00 support level. The bears stopped making strong swings below the SMA. At the same time, the price made more wicks, showing rejection below the 149.00 level.
Additionally, the RSI showed a bullish divergence, the clearest indication of fading momentum. This allowed bulls to break above the 30-SMA. However, bulls must now break above the 151.00 resistance to start making higher highs and lows. This would confirm a new bullish trend.
More By This Author:
AUD/USD Forecast: AUD Struggles After Weak Inflation ReportGold Outlook Vulnerable At Key Level, Deeper Correction In Sight
USD/CAD Forecast: Rallying Amid Soaring Yields, Tariff Woes
Disclosure: Equitymaster Agora Research Private Limited (Research Analyst) bearing Registration No. INH000000537 (hereinafter referred as 'Equitymaster') is an independent equity research ...
more


