USD/JPY Price Analysis: Trades Close To Seven-Week High Near 158.00
The USD/JPY pair jumps to near 158.00 in Monday’s American session. The asset extends its upside as Federal Reserve’s (Fed) hawkish narrative on the interest rate outlook has strengthened the US Dollar (USD) and the postponement of taper tantrum plans by the Bank of Japan (BoJ) has weakened the Japanese Yen.
The US Dollar Index (DXY), which tracks the Greenback’s value against six major currencies, trades sideways but clings to gains near 105.56. The Fed sees only one rate cut this year as policymakers want to see inflation declining for months.
Meanwhile, investors shifted focus to the United States (US) Retail Sales data for May, which will be published on Tuesday. Monthly Retail Sales are estimated to have increased by 0.3% after remaining flat in April.
The Japanese Yen remains on the backfoot as the BoJ pushes plans of tapering bond-buying operations to the July meeting. BoJ Governor Kazuo Ueda left interest rates unchanged but didn’t rule out expectations for further policy tightening in July.
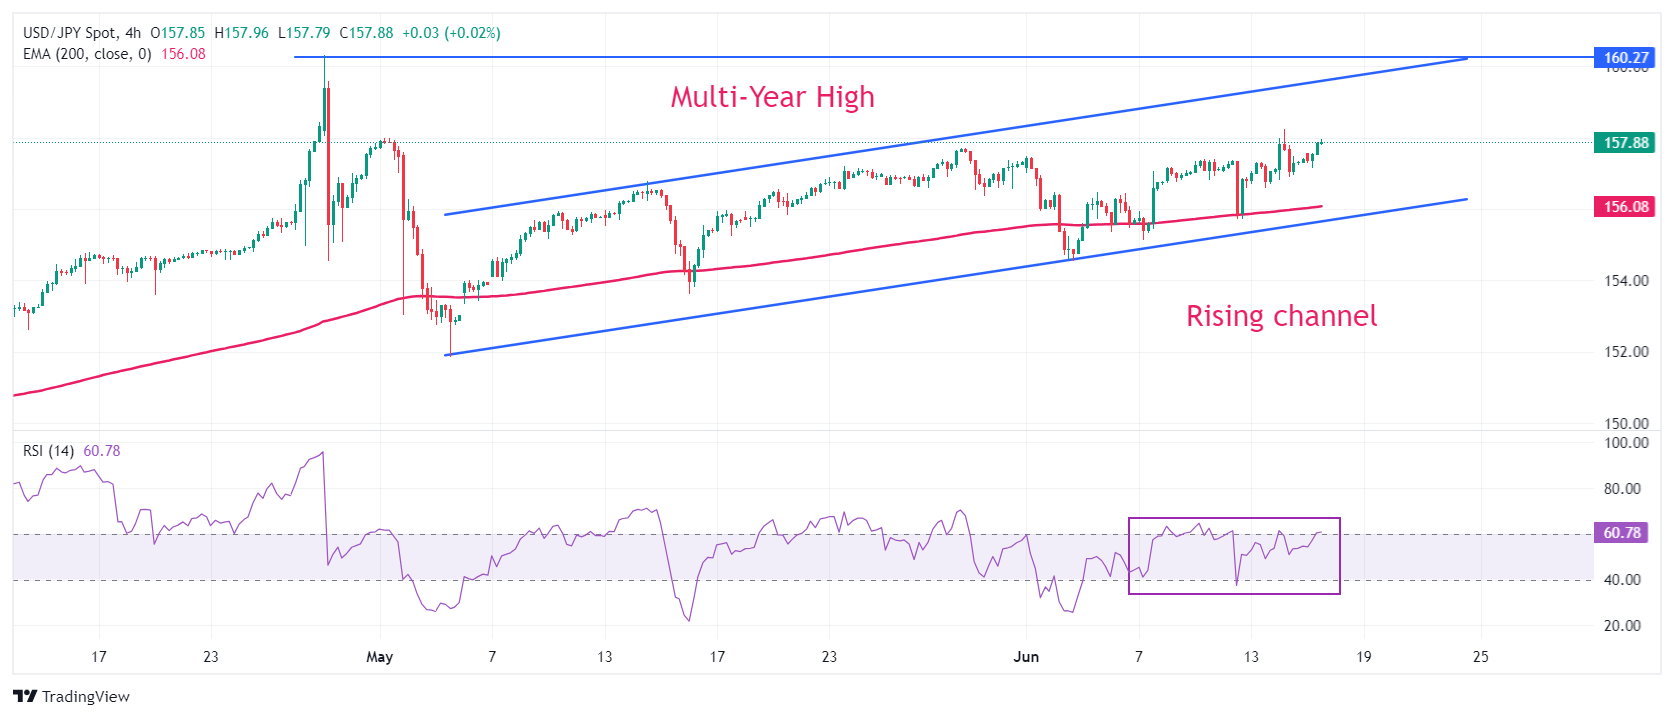
USD/JPY trades in a Rising Channel chart formation on a four-hour timeframe in which each corrective move is considered a buying opportunity by market participants. The asset remains above the 200-period Exponential Moving Average (EMA) near 156.00, suggesting that the overall trend is bullish.
The 14-period Relative Strength Index (RSI) hovers near 60.00. Momentum would lean towards the upside if the oscillator establishes above 60.00.
More upside would appear if the asset breaks above June 14 high at 158.26, which will drive it towards multi-year high of 160.00. Breach of the latter will expose the pair in an unchartered territory.
On the flip side, a breakdown below May 16 low at 153.60 will expose the asst towards May 3 low at 151.86, followed by the psychological support of 150.00.
USD/JPY four-hour chart
USD/JPY
| OVERVIEW | |
|---|---|
| Today last price | 157.88 |
| Today Daily Change | 0.49 |
| Today Daily Change % | 0.31 |
| Today daily open | 157.39 |
| TRENDS | |
|---|---|
| Daily SMA20 | 156.68 |
| Daily SMA50 | 155.56 |
| Daily SMA100 | 152.66 |
| Daily SMA200 | 150.07 |
| LEVELS | |
|---|---|
| Previous Daily High | 158.26 |
| Previous Daily Low | 156.81 |
| Previous Weekly High | 158.26 |
| Previous Weekly Low | 155.72 |
| Previous Monthly High | 157.99 |
| Previous Monthly Low | 151.86 |
| Daily Fibonacci 38.2% | 157.7 |
| Daily Fibonacci 61.8% | 157.36 |
| Daily Pivot Point S1 | 156.71 |
| Daily Pivot Point S2 | 156.04 |
| Daily Pivot Point S3 | 155.27 |
| Daily Pivot Point R1 | 158.16 |
| Daily Pivot Point R2 | 158.93 |
| Daily Pivot Point R3 | 159.6 |
More By This Author:
USD/CAD Remains Sideways Near 1.3750 As Investors Shift Focus To US Retail Sales Data
EUR/USD Consolidates As Investors Look For Fresh Cues On Fed’s Policy Outlook
USD/CAD Extends Upside To Near 1.3770 On Hawkish Fed Improves US Dollar’s Outlook
Disclaimer: Information on this article contains forward-looking statements that involve risks and uncertainties. Markets and instruments profiled on this page are for informational purposes ...
more


