
USD/JPY has reached the top of a rising channel it has been in since the start of 2023. Although it is in an uptrend on all timeframes there is a growing risk it is about to correct back.
USD/JPY Daily Chart
(Click on image to enlarge)
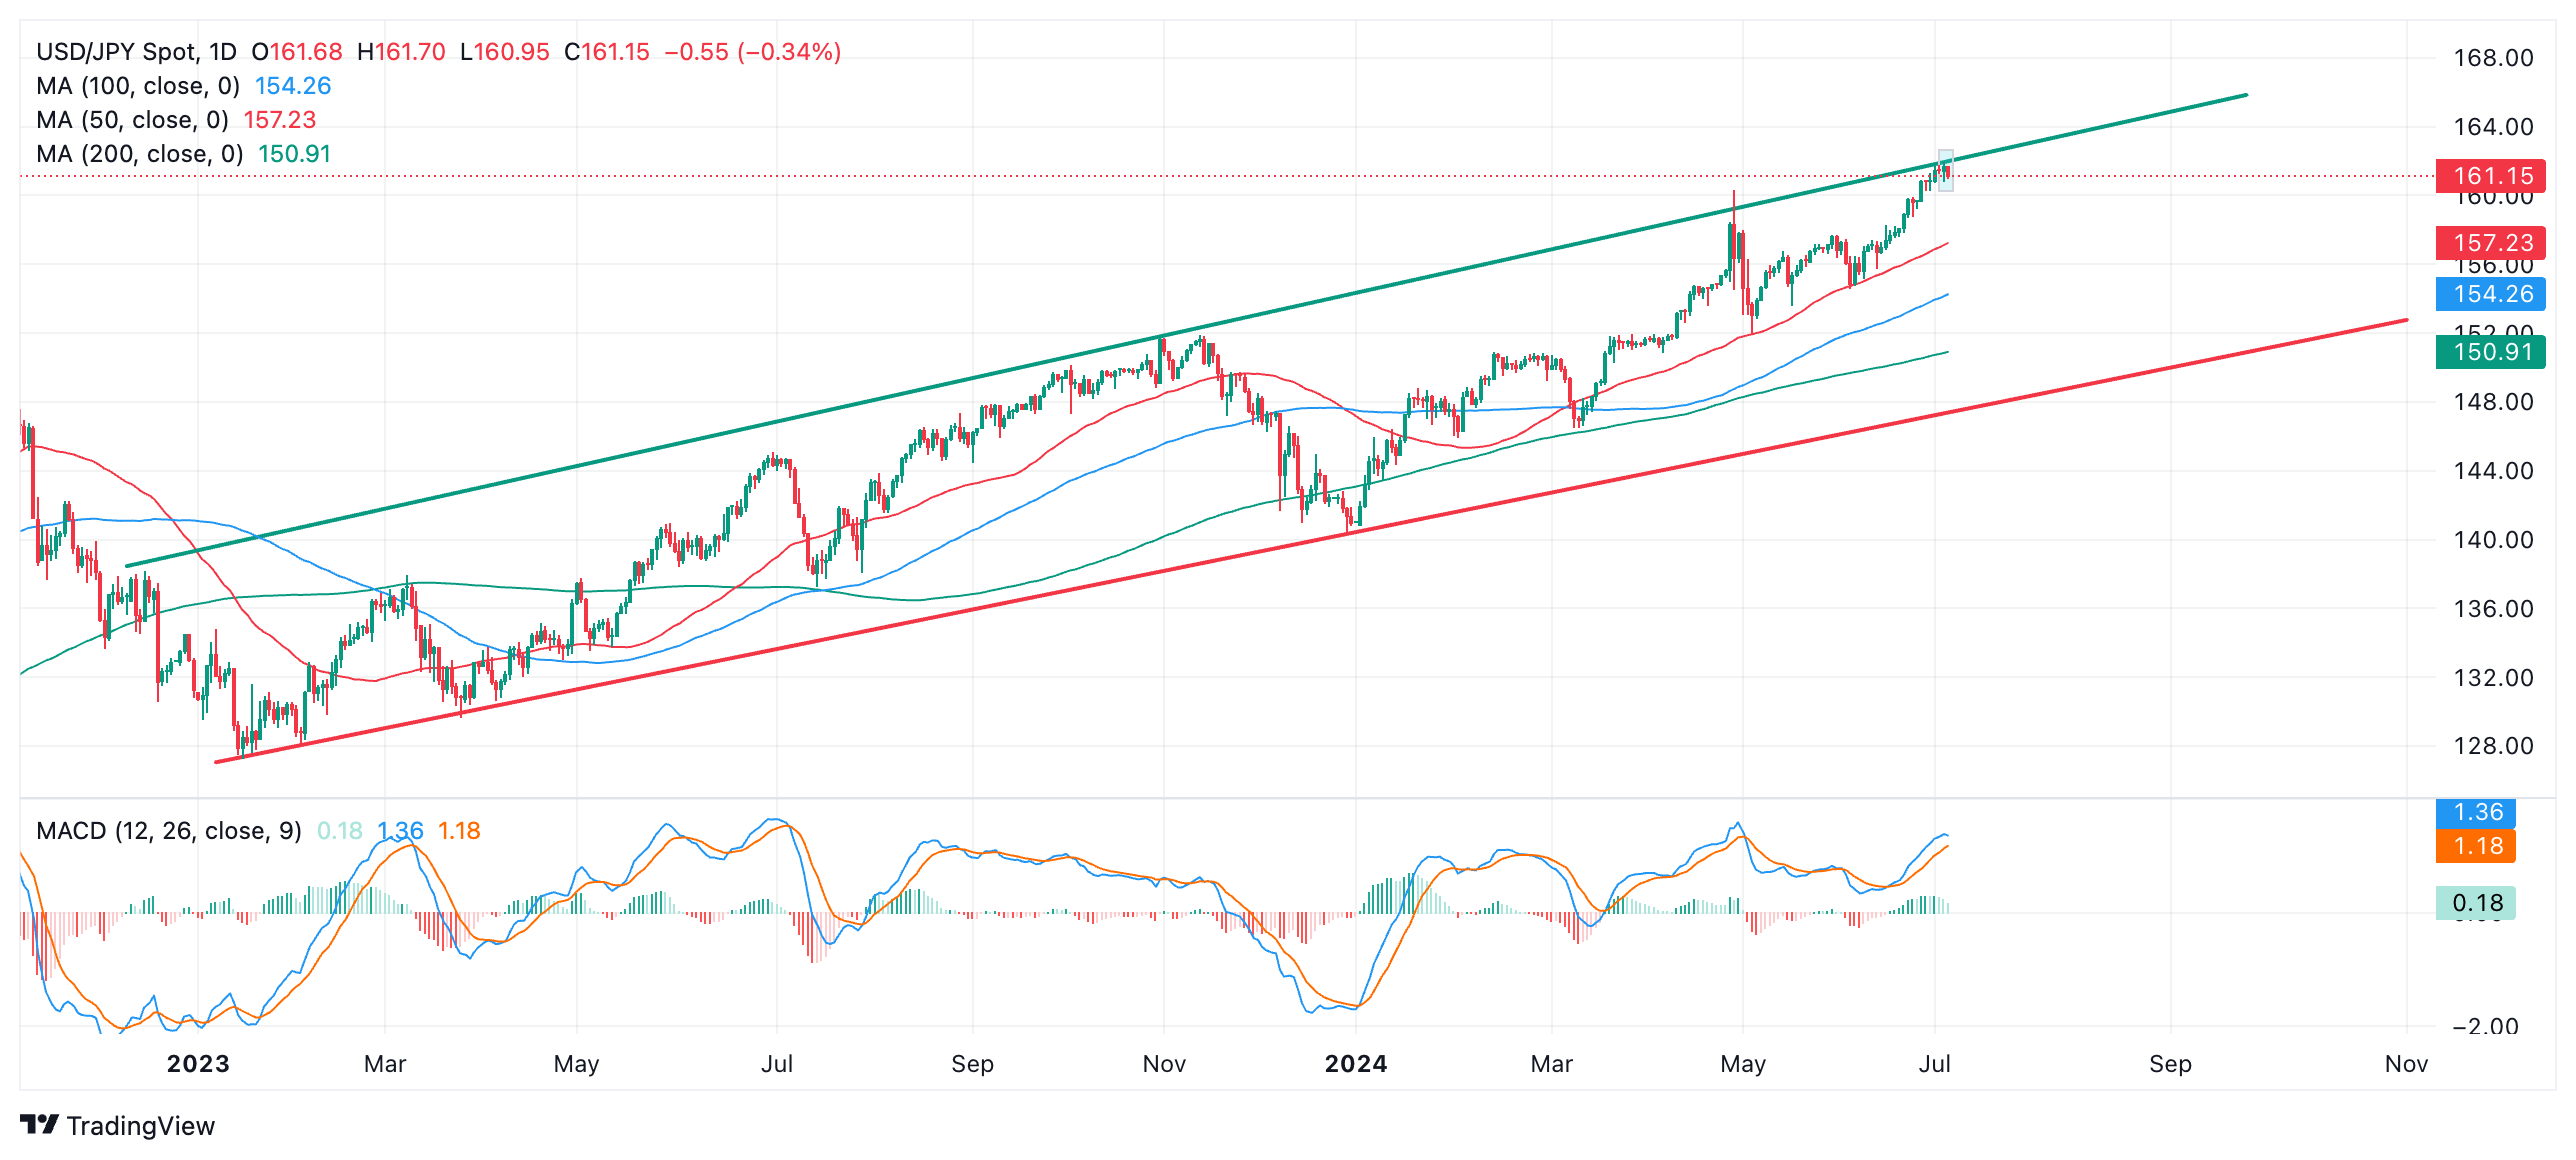
The top of the channel will present resistance to bulls acting as a barrier to them pushing price higher.
USD/JPY posted a bearish Hanging Man Japanese candlestick pattern on Wednesday July 3 (blue-shaded rectangle) and this is further evidence a reversal may be developing. A Hanging Man develops when a candle forms at a peak with a small body near its high and a long wick below.
USD/JPY Daily Chart
(Click on image to enlarge)
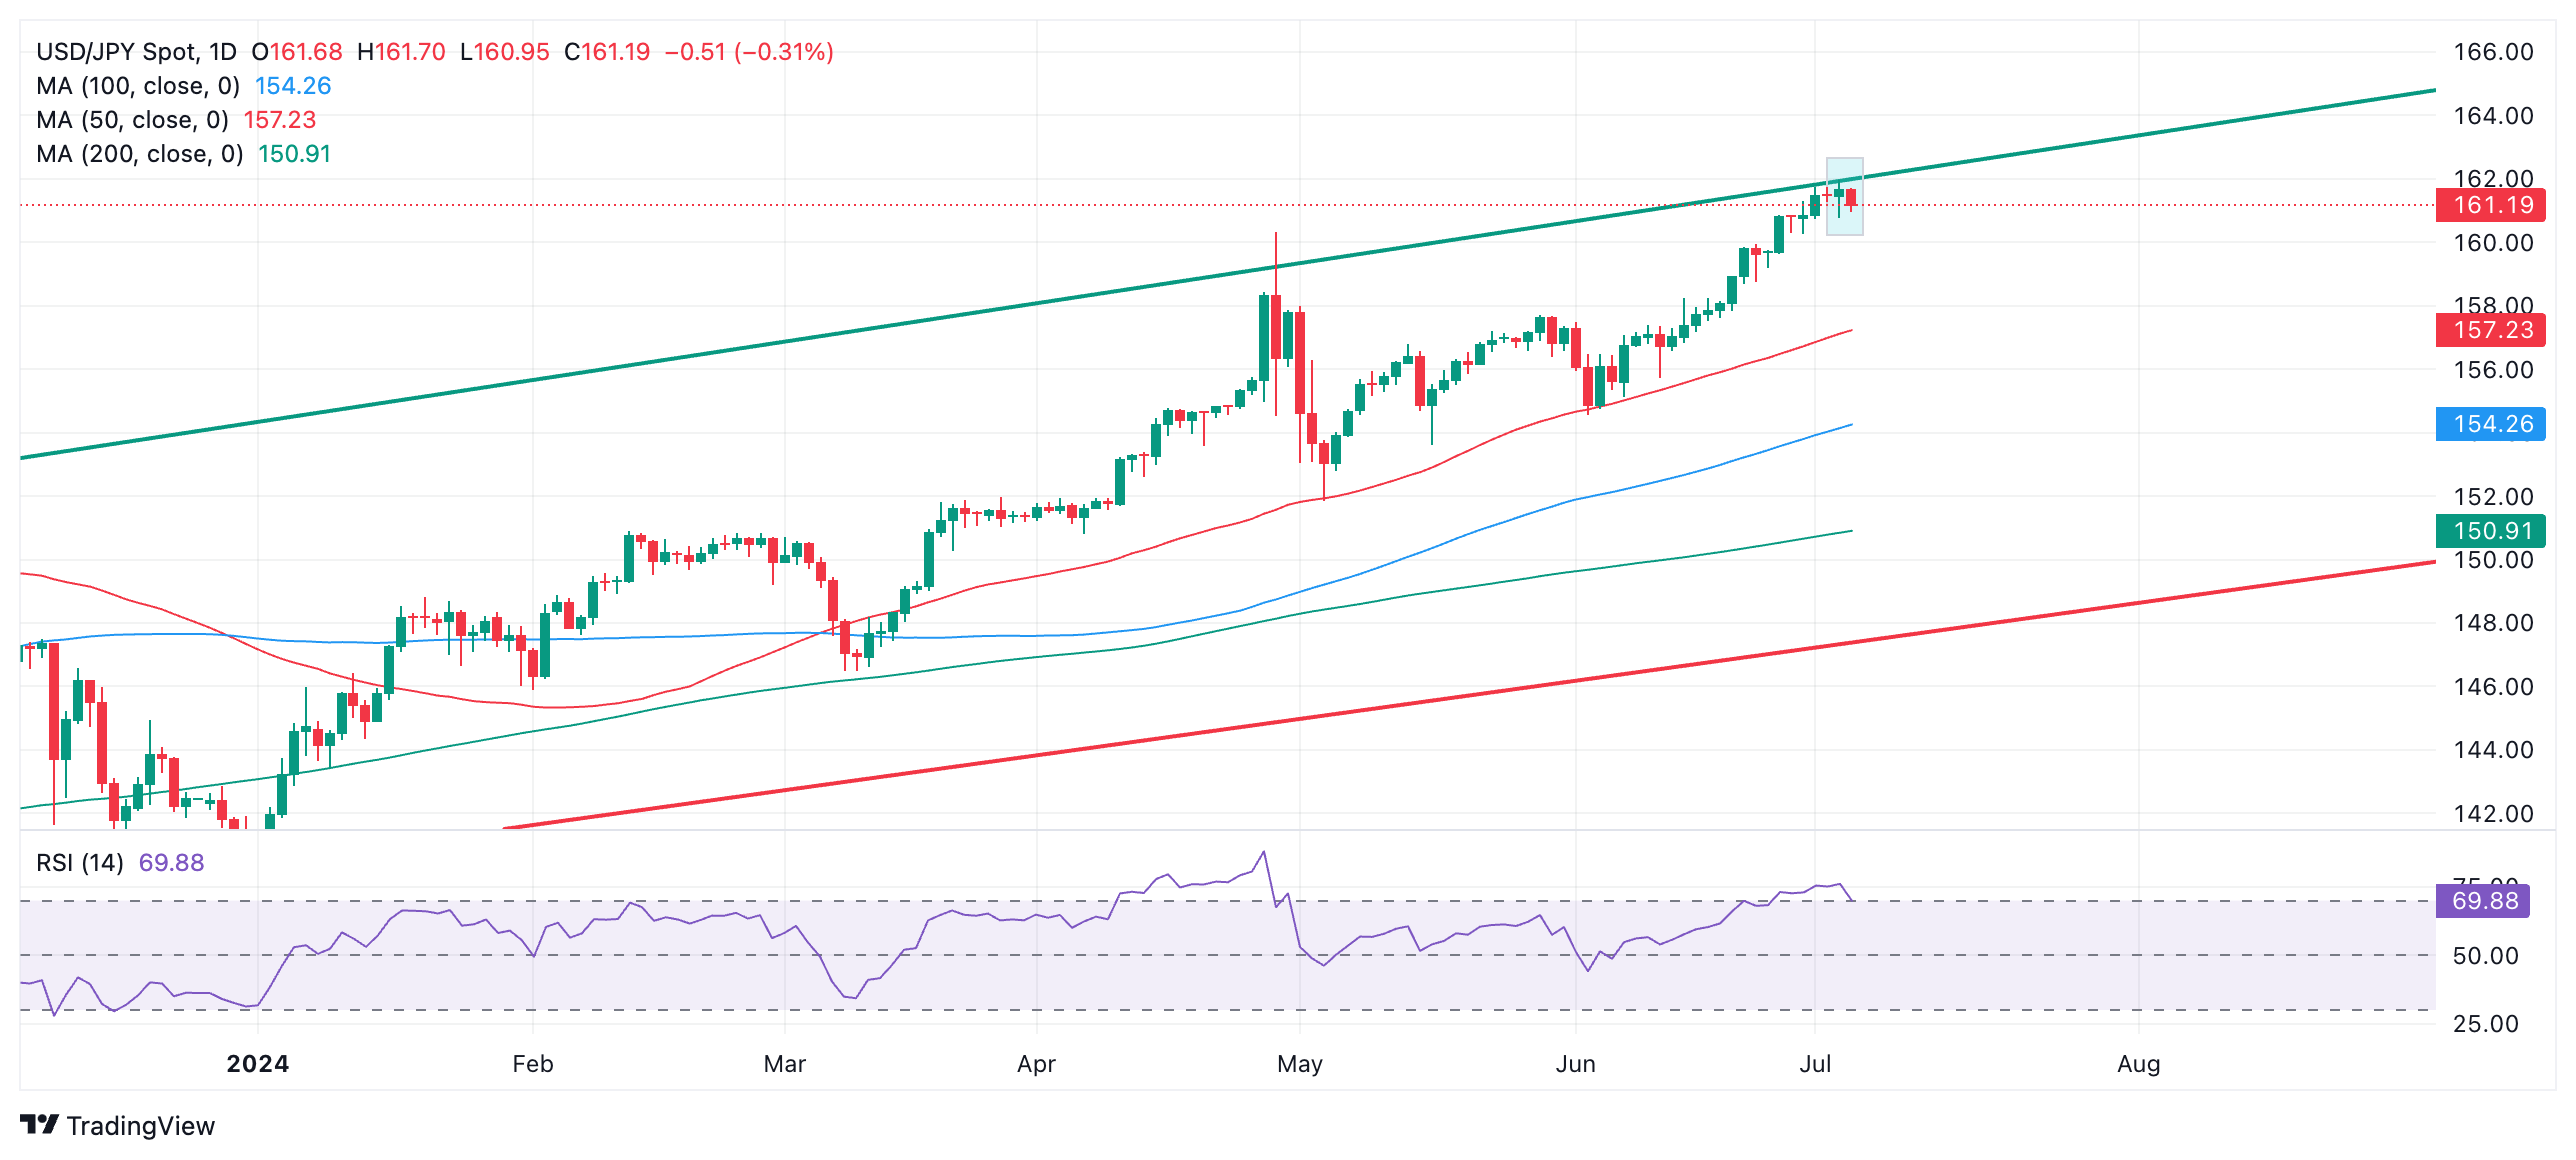
If Thursday ends as a red bearish candlestick it will provide confirmation of a short-term reversal.
The Relative Strength Index (RSI) momentum indicator is currently at 69.88. It is exiting the overbought zone. If it closes below 70 – as looks likely – it will provide a sell signal and further evidence of a short-term reversal.
The resulting pull-back will probably fall down to support at around the 50-day Simple Moving Average (SMA) at 157.23. This has provided support on several occasions during USD/JPY’s uptrend. A break below 160.26 would add confirmation price could hit the bearish target.
On the other hand, a decisive break out of the top of the channel would invalidate the bearish hypothesis and indicate a move higher, perhaps to 164.00 initially. Upside momentum beyond that, however, is unlikely to sustain for long.
A decisive break would be one accompanied by a long green candle that broke clearly through the channel line and closed near its high, or three green candles in a row that broke above the channel line.
More By This Author:
XAG/USD Pulls Back From Two-week Peak, Downside Seems LimitedGold Price Sits Near Two-Week Peak, Lacks Follow-Through Amid Upbeat Market Mood
Australian Dollar Traded Strong On Wednesday, Focus Shifts To US Labor Market Data


Comments
Log in or sign up to join the conversation.