
The USD/JPY extended its gains late on Friday’s North American session, though it’s set to finish the week unchanged. The major trades at 155.66, up 0.18% after hitting a daily low of 155.25.
USD/JPY Price Analysis: Technical outlook
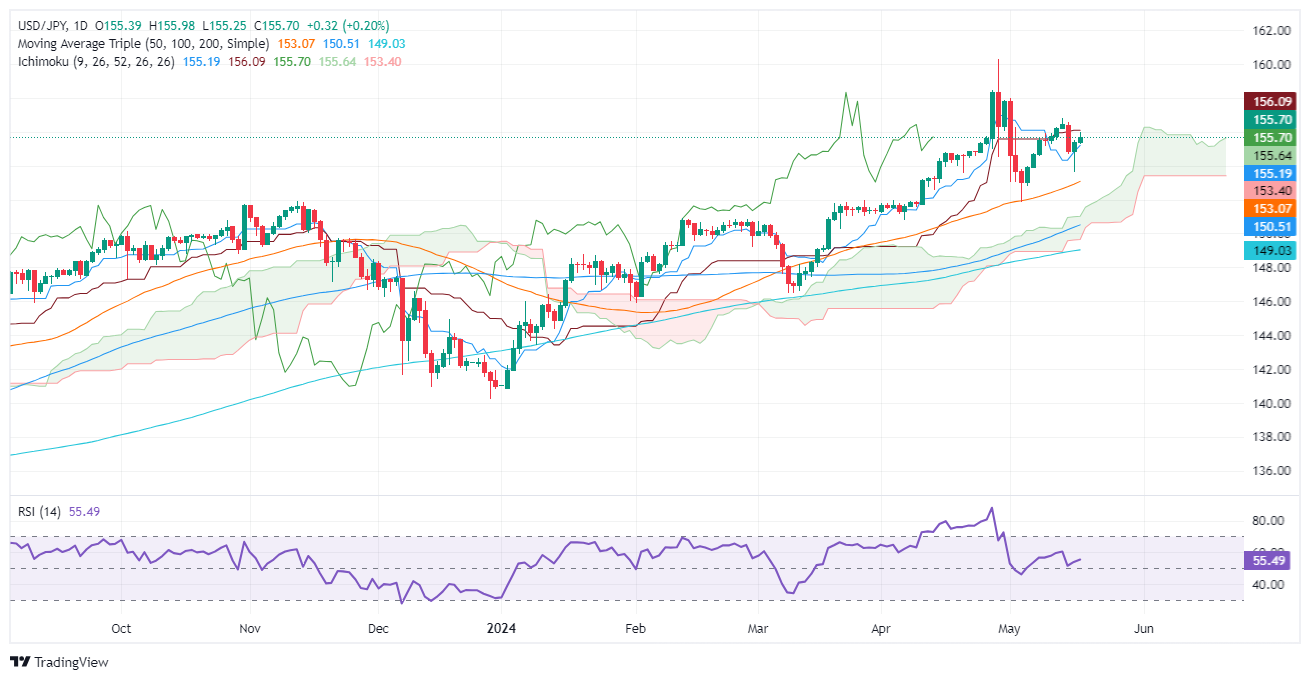
Despite the conditions to extend their gains, traders should be aware of the Japanese authority's intervention threats. That said, the USD/JPY uptrend remains intact as long as price action achieves two goals: persisting above the Ichimoku Cloud (Kumo) and staying above the uptrend trendline drawn from the January 2024 lows.
The Relative Strength Index (RSI) favors buyers, standing above the 50-midline with enough room to spare before reaching overbought territory.
Therefore, the path of least resistance is upwards. The first resistance would be the Kijun-Sen at 156.05. Once cleared, the next stop would be 157.00, followed by the April 26 high of 158.44, ahead of challenging the year-to-date (YTD) high at 160.32.
On the flip side, if USD/JPY drops below the Senkou Span A of 155.69, the pair could be headed towards retesting lower support levels. Bulls' first line of defense would be the Tenkan-Sen at 155.18, followed by 155.00. Once hurdled, the next stop would be the May 16 low of 153.60, followed by the Sekou Span B at 153.06.
USD/JPY Price Action – Daily Chart
(Click on image to enlarge)
USD/JPY
| OVERVIEW | |
|---|---|
| Today last price | 155.69 |
| Today Daily Change | 0.30 |
| Today Daily Change % | 0.19 |
| Today daily open | 155.39 |
| TRENDS | |
|---|---|
| Daily SMA20 | 155.37 |
| Daily SMA50 | 152.9 |
| Daily SMA100 | 150.36 |
| Daily SMA200 | 148.98 |
| LEVELS | |
|---|---|
| Previous Daily High | 155.54 |
| Previous Daily Low | 153.6 |
| Previous Weekly High | 155.95 |
| Previous Weekly Low | 152.8 |
| Previous Monthly High | 160.32 |
| Previous Monthly Low | 150.81 |
| Daily Fibonacci 38.2% | 154.8 |
| Daily Fibonacci 61.8% | 154.34 |
| Daily Pivot Point S1 | 154.15 |
| Daily Pivot Point S2 | 152.91 |
| Daily Pivot Point S3 | 152.21 |
| Daily Pivot Point R1 | 156.08 |
| Daily Pivot Point R2 | 156.78 |
| Daily Pivot Point R3 | 158.02 |
JAPANESE YEN PRICE TODAY
The table below shows the percentage change of Japanese Yen (JPY) against listed major currencies today. Japanese Yen was the strongest against the Swiss Franc.
| USD | EUR | GBP | JPY | CAD | AUD | NZD | CHF | |
|---|---|---|---|---|---|---|---|---|
| USD | -0.02% | -0.25% | 0.19% | -0.04% | -0.24% | -0.23% | 0.30% | |
| EUR | 0.02% | -0.24% | 0.22% | -0.01% | -0.20% | -0.19% | 0.30% | |
| GBP | 0.25% | 0.24% | 0.44% | 0.22% | 0.04% | 0.03% | 0.53% | |
| JPY | -0.19% | -0.22% | -0.44% | -0.26% | -0.43% | -0.45% | 0.09% | |
| CAD | 0.04% | 0.01% | -0.22% | 0.26% | -0.19% | -0.18% | 0.33% | |
| AUD | 0.24% | 0.20% | -0.04% | 0.43% | 0.19% | 0.00% | 0.51% | |
| NZD | 0.23% | 0.19% | -0.03% | 0.45% | 0.18% | -0.01% | 0.51% | |
| CHF | -0.30% | -0.30% | -0.53% | -0.09% | -0.33% | -0.51% | -0.51% |
More By This Author:
AUD/USD Falls Amid Highs US Yields, Fed’s Tough StanceAUD/USD Extends Rally As Buyers’ Eye 0.6700 Ahead Of Aussie’s Job Data
Silver Price Analysis: XAG/USD Retreats As Shooting Star Looms, Sellers Eye $28.00


Comments
Log in or sign up to join the conversation.