
USD/JPY has probably reversed its short-term downtrend and is now trending higher after establishing a new sequence of higher highs and higher lows. Given “the trend is your friend” this suggests a bullish bias exists over the short term.
USD/JPY 4-hour Chart
(Click on image to enlarge)
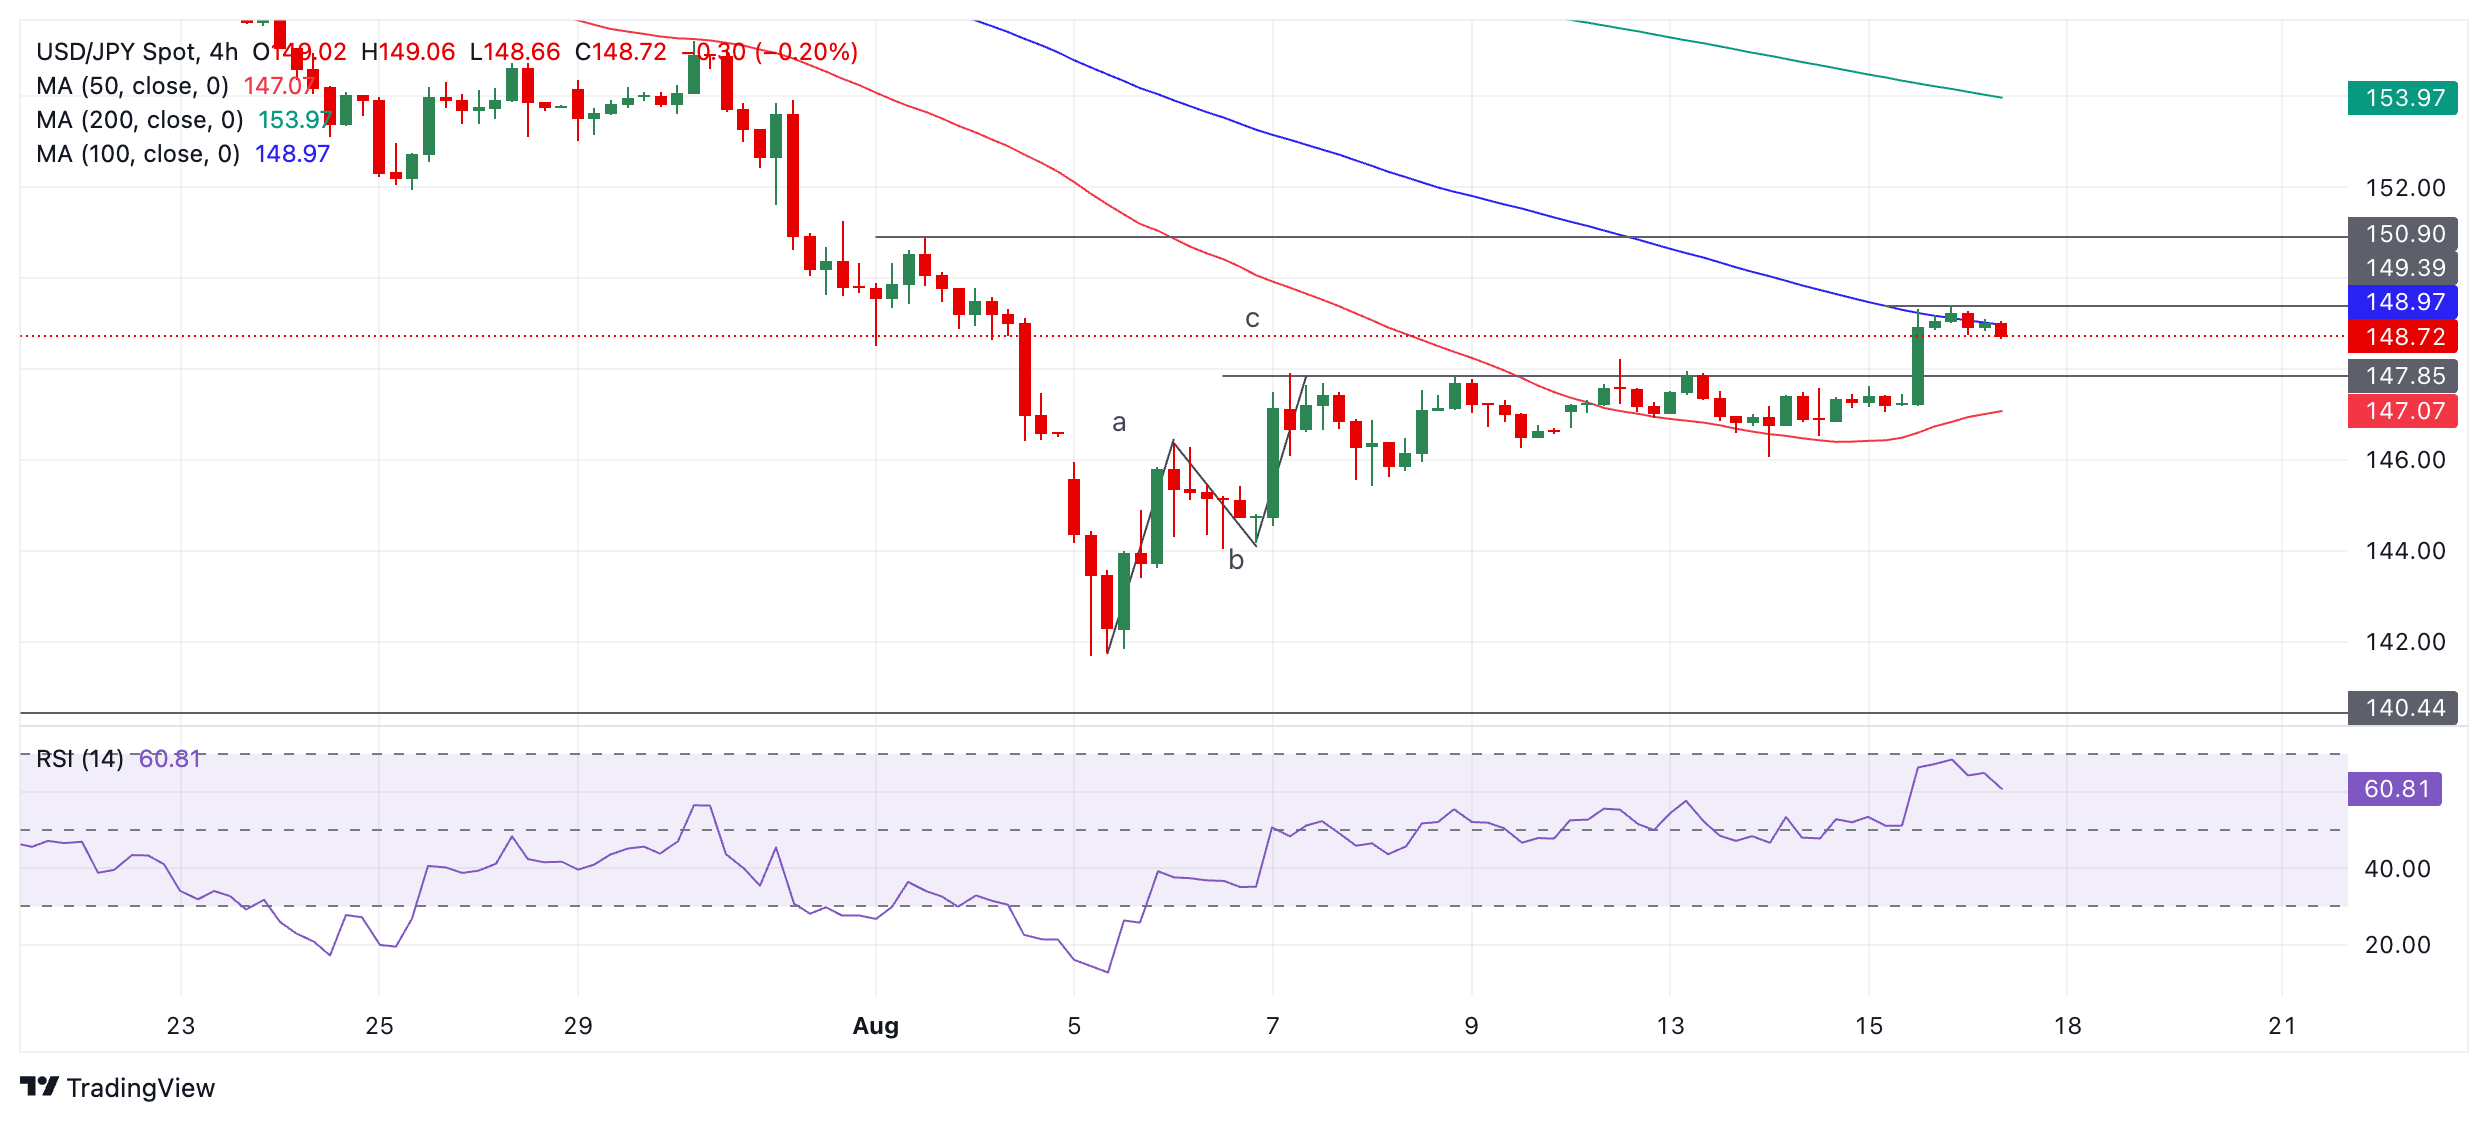
The change in trend comes about after the pair continued rising despite completing an abc correction between August 5-7. Normally the completion of the abc correction would have been a signal the pullback had ended and the dominant downtrend was about to resume. However, in the case of USD/JPY the pair failed to decline and instead traded sideways before breaking decisively higher on August 15.
The break above the top of wave c indicates the short-term trend is now probably bullish and therefore more likely than not to continue rising. The 100-period Simple Moving Average (blue) is currently capping gains but a close above it would probably confirm a continuation higher to a target at 150.90 (August 1 swing high), followed by 151.94 (July 25 swing low) and then perhaps 155.22 (July 30 swing high).
More By This Author:
USD/CAD Hovers Around 50-Day SMA, Remains On The Defensive Below Mid-1.3700sWTI Trades With Modest Losses Below $77.00, Downside Potential Seems Limited
USD/JPY Surges Above 149.00 After Upbeat US Data


Comments
Log in or sign up to join the conversation.