
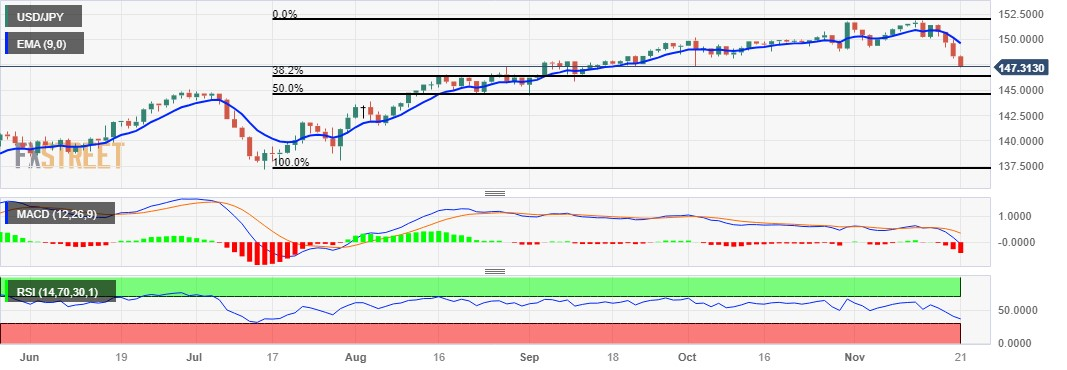
USD/JPY extended the losing streak that began on Thursday and marked an eight-week low, trading around 147.40 during the European session on Tuesday. The 147.00 psychological level emerges as the immediate support following the 38.2% Fibonacci retracement at 146.32.
The US Dollar (USD) has plunged to a nearly three-month low, influenced by dovish expectations from the Federal Reserve (Fed). This development is a significant factor contributing to the decline of the USD/JPY pair.
The 14-day Relative Strength Index (RSI) lies below the 50 level, signaling a weaker sentiment for the USD/JPY pair. This could potentially prompt bearish movements toward the psychological support region around 146.00. If a decisive break occurs below this level, it may pave the way for the USD/JPY pair to navigate the area near the 50.0% retracement at the 144.60 level.
Moreover, the Moving Average Convergence Divergence (MACD) line is positioned below the centerline and diverges below the signal line, signaling a bearish momentum in the market for the USD/JPY pair.
On the upside, the major level at 147.50 serves as the immediate barrier, followed by the psychological level at 148.00. A breakthrough above the latter could provide support for the USD/JPY pair to explore the region around the 149.00 level following the nine-day Exponential Moving Average (EMA) at 149.62.
USD/JPY: Daily Chart
(Click on image to enlarge)
USD/JPY: MORE TECHNICAL LEVELS TO WATCH
| OVERVIEW | |
|---|---|
| Today last price | 147.45 |
| Today Daily Change | -0.89 |
| Today Daily Change % | -0.60 |
| Today daily open | 148.34 |
| TRENDS | |
|---|---|
| Daily SMA20 | 150.41 |
| Daily SMA50 | 149.49 |
| Daily SMA100 | 146.54 |
| Daily SMA200 | 141.47 |
| LEVELS | |
|---|---|
| Previous Daily High | 149.99 |
| Previous Daily Low | 148.1 |
| Previous Weekly High | 151.91 |
| Previous Weekly Low | 149.2 |
| Previous Monthly High | 151.72 |
| Previous Monthly Low | 147.32 |
| Daily Fibonacci 38.2% | 148.82 |
| Daily Fibonacci 61.8% | 149.27 |
| Daily Pivot Point S1 | 147.63 |
| Daily Pivot Point S2 | 146.92 |
| Daily Pivot Point S3 | 145.74 |
| Daily Pivot Point R1 | 149.52 |
| Daily Pivot Point R2 | 150.7 |
| Daily Pivot Point R3 | 151.41 |
More By This Author:
EUR/JPY Price Analysis: Extends Its Downside, The Next Contention Level Is Seen At 161.60S&P 500 Forecast: Quiet Thanksgiving Week Makes Nvidia Earnings The Focal Point
GBP/USD Climbs Back Closer To Over Two-Month Top, Bulls Flirt With 100-day SMA Near 1.2500


Comments
Log in or sign up to join the conversation.