USD/JPY Price Analysis: Correction From Top Of Channel Finds Support
USD/JPY has corrected back after touching the top of a rising channel it has been in since the start of 2023.
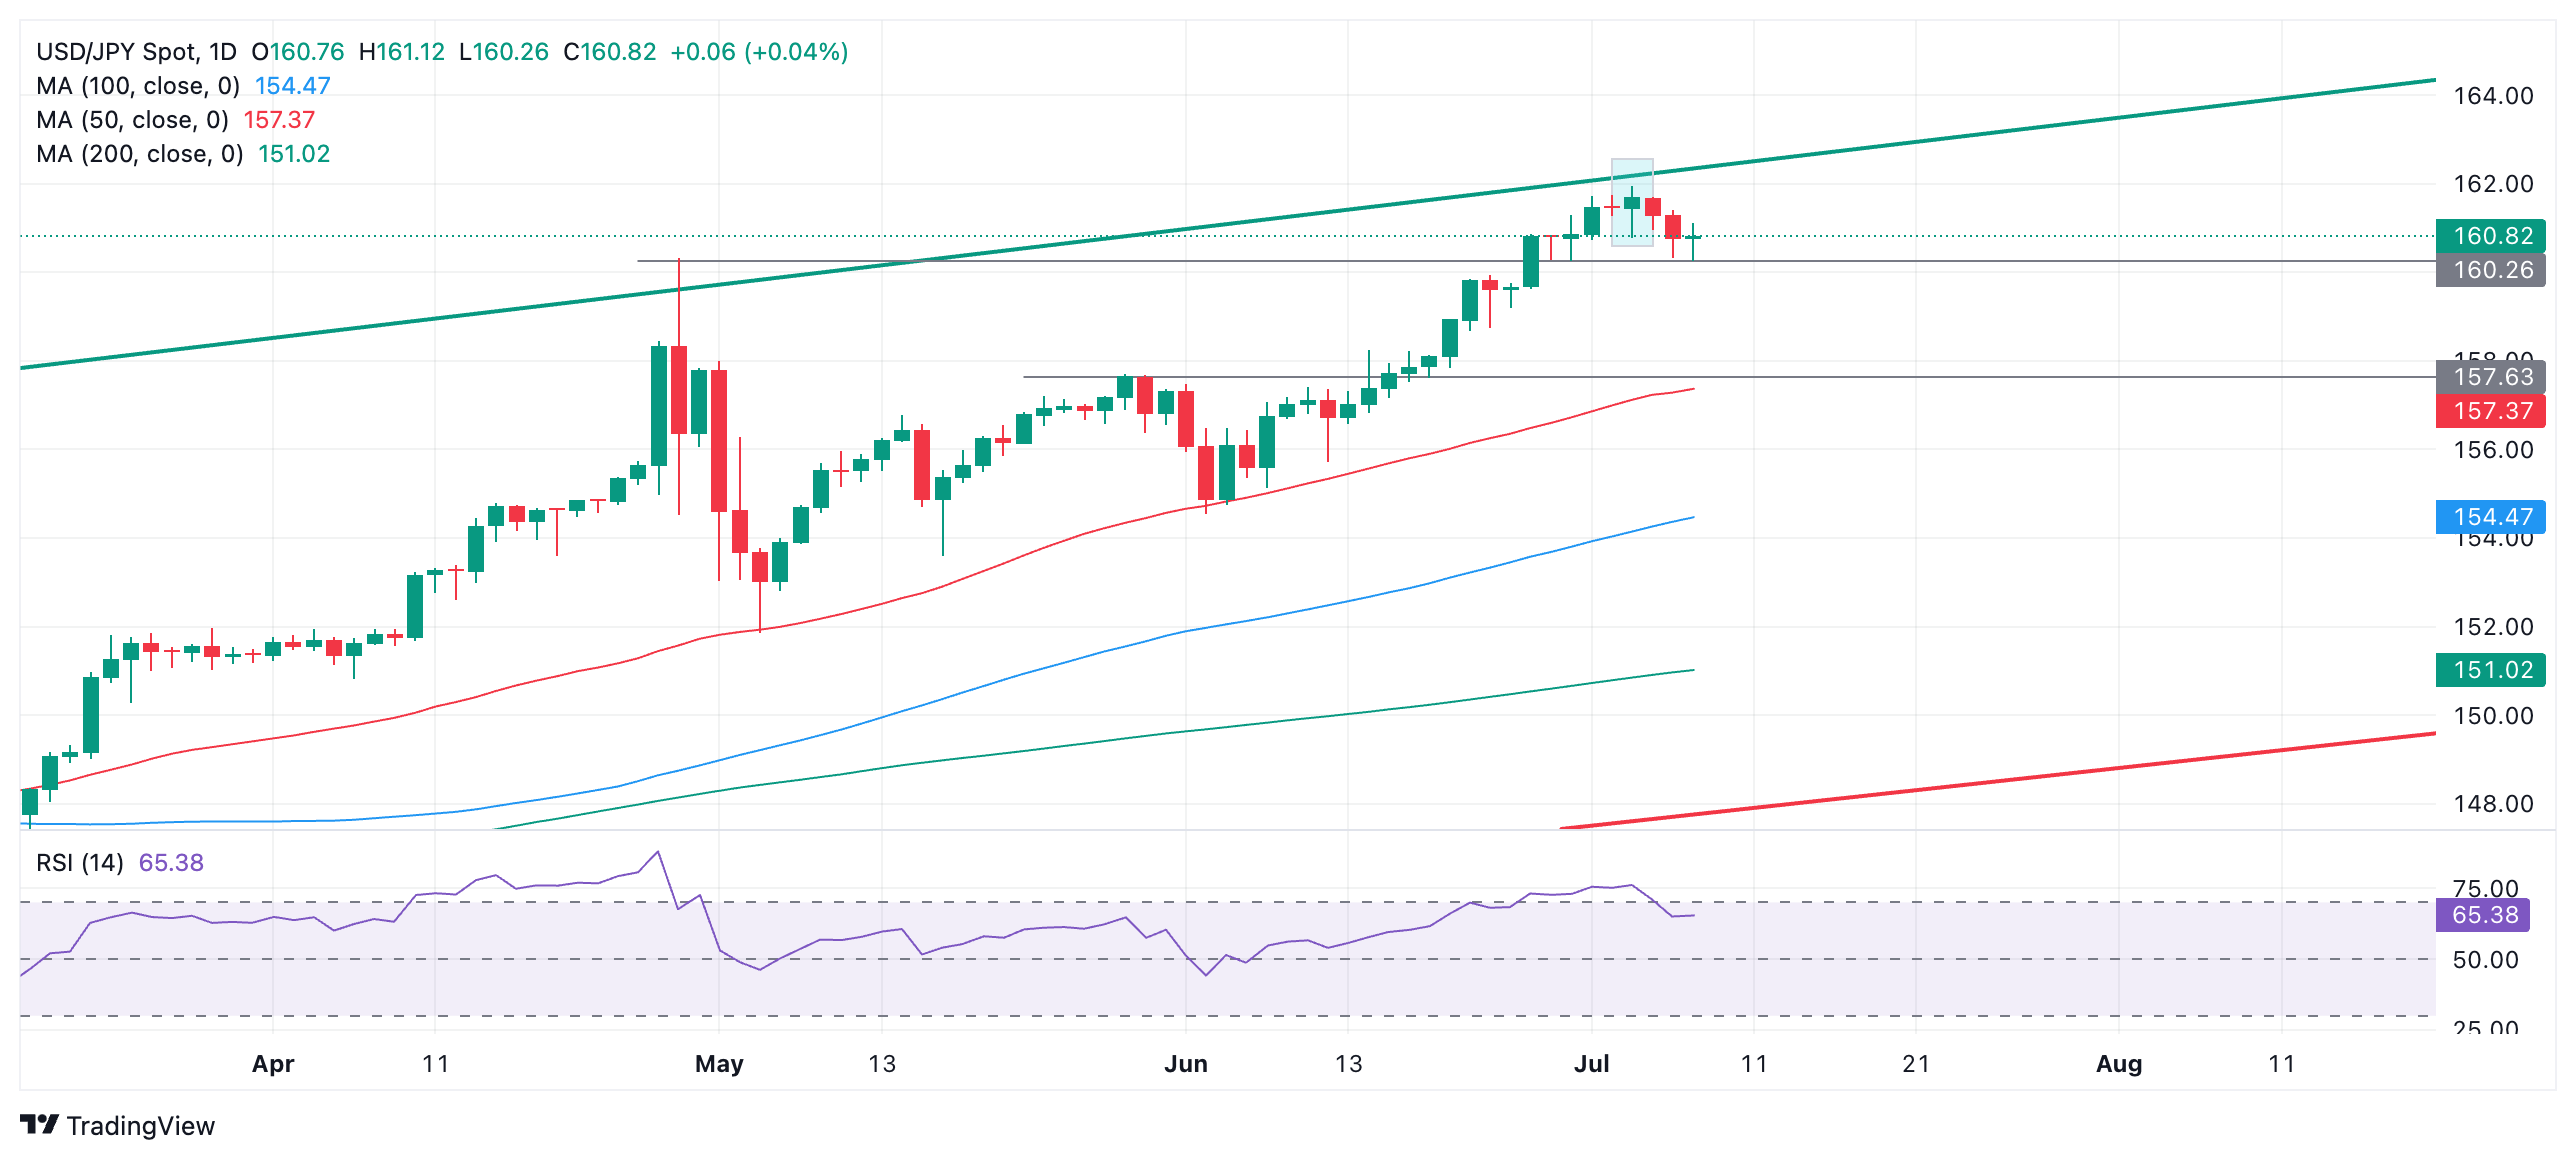
USD/JPY Daily Chart
(Click on image to enlarge)
USD/JPY posted a bearish Hanging Man Japanese candlestick pattern on Wednesday July 3 (blue-shaded rectangle). The Hanging Man develops when a candle forms at a peak with a small body near its high and a long wick below. It was followed by a bearish down day, providing bearish confirmation.
USD/JPY proceeded to sell-off down to support from the April 29 high at 160.32, forming a price gap at the end of the move down – a possible sign of exhaustion.
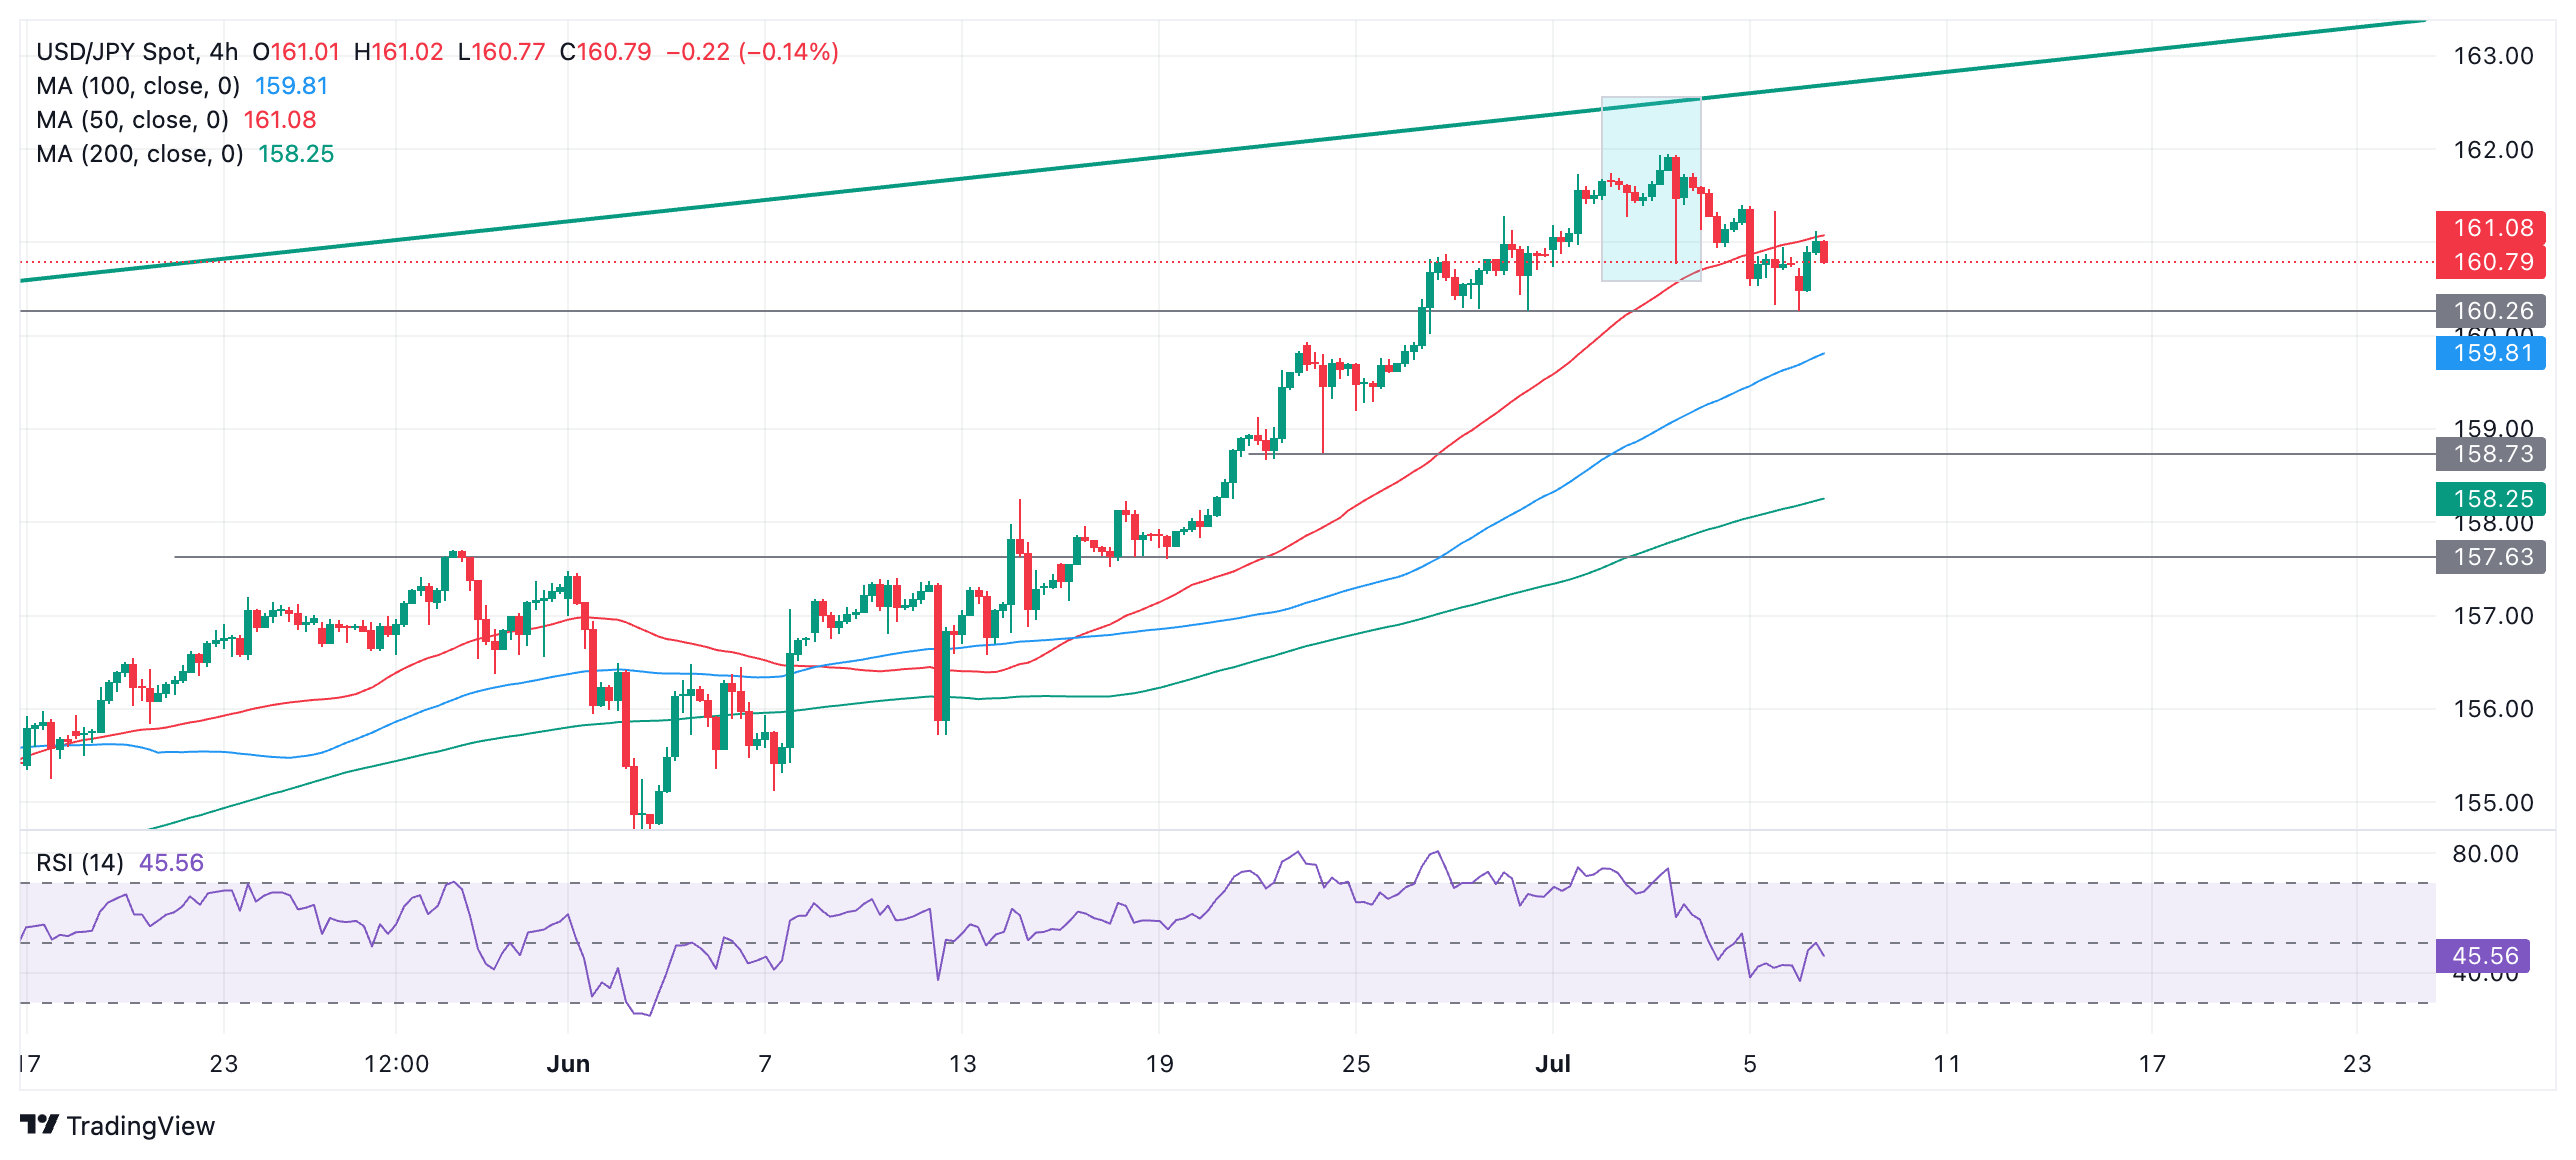
USD/JPY 4-hour Chart
(Click on image to enlarge)
The pair has since recovered on July 8 (today) and filled the gap in the process. It is currently trading up against resistance from the 50-period Simple Moving Average (SMA).
Given the possible exhaustion gap that formed at the end of the sell-off, and the fact that it is in a strong medium and long-term uptrend, there is a risk the pair could continue recovering. Most corrections are composed of three waves and so far the rebound has only formed one complete wave. It is possible it could at the least recover even higher, to a target at 161.40, the July 5 high, as it completes.
More By This Author:
Mexican Peso Rises For Fourth Day In A Row Against USDEUR/GBP Price Analysis: Signs The Downtrend Could Be Resuming
USD/CHF Languishes Near Multi-Day Low, Below 0.9000 As Traders Look To US NFP
Disclaimer: Information on this article contains forward-looking statements that involve risks and uncertainties. Markets and instruments profiled on this page are for informational purposes ...
more


