USD/JPY Price Analysis: Bulls Await A Breakout Through One-Week-Old Trading Range, US CPI In Focus
Image Source: Unsplash
- USD/JPY remains confined in a familiar range, forming a rectangle on short-term charts.
- The technical setup seems tilted in favour of bulls and supports prospects for further gains.
- Traders now seem reluctant and prefer to wait on the sidelines ahead of the US CPI report.
The USD/JPY pair oscillates in a narrow trading band during the Asian session on Thursday and is currently placed just above the 149.00 mark, well within the striking distance of the weekly high touched the previous day.
A generally positive risk tone, along with the Bank of Japan's (BoJ) persistent ultra-easy monetary policy, is seen undermining the safe-haven Japanese Yen (JPY) and acting as a tailwind for the USD/JPY pair. The upside, however, remains limited in the wake of subdued US Dollar (USD) price action, which continues to be weighed down by diminishing odds for more rate hikes by the Federal Reserve (Fed) and a further decline in the US Treasury bond yields.
Traders also seem reluctant to place aggressive directional bets and prefer to wait on the sidelines ahead of the release of the latest US consumer inflation figures, due later during the early North American session. The crucial US CPI report will play a key role in influencing market expectations about the Fed's future rate hike path. This, in turn, will drive the USD demand in the near term and help determine the next leg of a directional move for the USD/JPY pair.
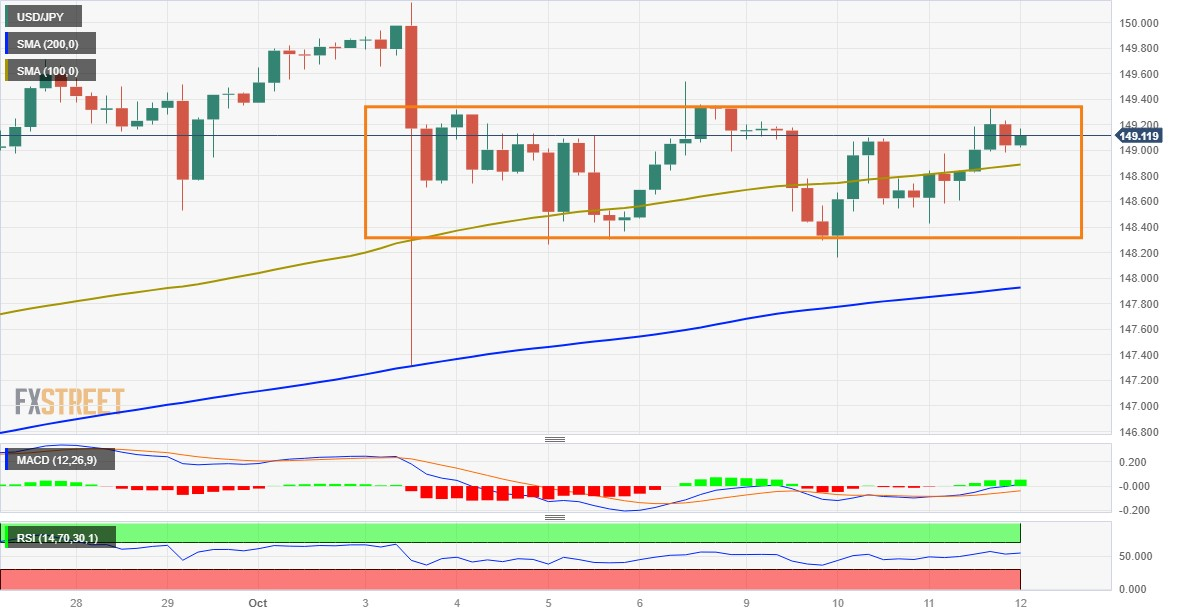
From a technical perspective, spot prices remain confined in a familiar range held over the past week or so. This constitutes the formation of a rectangle on short-term charts and points to indecision among traders. The range-bound price action, meanwhile, might still be categorized as a bullish consolidation phase, against the backdrop of a rally from the July monthly swing low. Adding to this, oscillators on the daily chart are still holding in the positive territory.
The aforementioned setup suggests that the path of least resistance for the USD/JPY pair is to the upside. That said, it will still be prudent to wait for a sustained breakout through the 149.30-149.35 supply zone, representing the top end of the trading range, before positioning for any further gains. The subsequent move-up has the potential to lift spot prices back towards the 150.00 psychological mark, which has been speculated as the potential intervention level.
A sustained strength beyond, however, will be seen as a fresh trigger for bullish traders and pave the way for a further appreciating move toward the 151.00 round figure. The momentum could get extended and push the USD/JPY pair closer to the 152.00 mark, or a multi-decade high touched in October 2022.
On the flip side, any meaningful corrective decline now seems to find some support near the 148.55-148.50 zone ahead of the weekly low, around the 148.15 area. This is followed by the 200-period Simple Moving Average (SMA) on the 4-hour chart, currently pegged just below the 148.00 round figure. A convincing break below could drag the USD/JPY pair to the 147.30 area, or the lowest level since September 14 touched last Tuesday.
USD/JPY daily chart
(Click on image to enlarge)
Technical levels to watch
USD/JPY
| OVERVIEW | |
|---|---|
| Today last price | 149.09 |
| Today Daily Change | -0.07 |
| Today Daily Change % | -0.05 |
| Today daily open | 149.16 |
| TRENDS | |
|---|---|
| Daily SMA20 | 148.68 |
| Daily SMA50 | 146.87 |
| Daily SMA100 | 144.04 |
| Daily SMA200 | 138.7 |
| LEVELS | |
|---|---|
| Previous Daily High | 149.32 |
| Previous Daily Low | 148.43 |
| Previous Weekly High | 150.16 |
| Previous Weekly Low | 147.32 |
| Previous Monthly High | 149.71 |
| Previous Monthly Low | 144.44 |
| Daily Fibonacci 38.2% | 148.98 |
| Daily Fibonacci 61.8% | 148.77 |
| Daily Pivot Point S1 | 148.62 |
| Daily Pivot Point S2 | 148.07 |
| Daily Pivot Point S3 | 147.72 |
| Daily Pivot Point R1 | 149.52 |
| Daily Pivot Point R2 | 149.87 |
| Daily Pivot Point R3 | 150.42 |
More By This Author:
USD/SEK Consolidates Losses After Hot PPI Figures From The US, Cautious FOMC MinutesGold Price Analysis: XAU/USD Struggling To Find Momentum Above $1,870 After FOMC Minutes Non-Starter
US Annual PPI Rises 2.2% In September Vs. 1.6% Expected
Disclosure: Information on this article contains forward-looking statements that involve risks and uncertainties. Markets and instruments profiled on this page are for informational purposes ...
more


