
USD/JPY Post-NFP Rally Stalls Ahead Of US Inflation Report
USD/JPY trades within Friday’s range even as longer-dated US Treasury yields push to fresh yearly highs, with a head-and-shoulders formation starting to take shape following the failed attempt to test the January high (116.35).
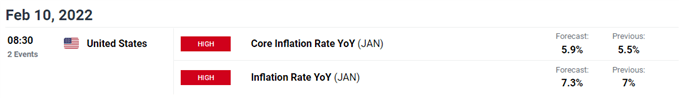
Nevertheless, the update to the US Consumer Price Index (CPI) may help to invalidate the reversal pattern as inflation is expected to increase for the fifth consecutive month, with the headline reading projected to increase to 7.3% from 7.0% per annum in December, which would mark the highest reading since 1982.
Evidence of persistent inflation may generate a bullish reaction in the US Dollar as it puts pressure on the Federal Reserve to normalize monetary policy sooner rather than later, and USD/JPY may exhibit a bullish trend in 2022 as the Bank of Japan (BoJ) remains in no rush to switch gears.
As a result, the decline from the January high (116.32) may turn out to be a correction in the broader trend as the Federal Open Market Committee (FOMC) prepares to implement higher interest rates, and the diverging paths between the Fed and BoJ may continue to foster the crowding behavior seen in late-2021 as the recent flip in retail sentiment was short-lived.
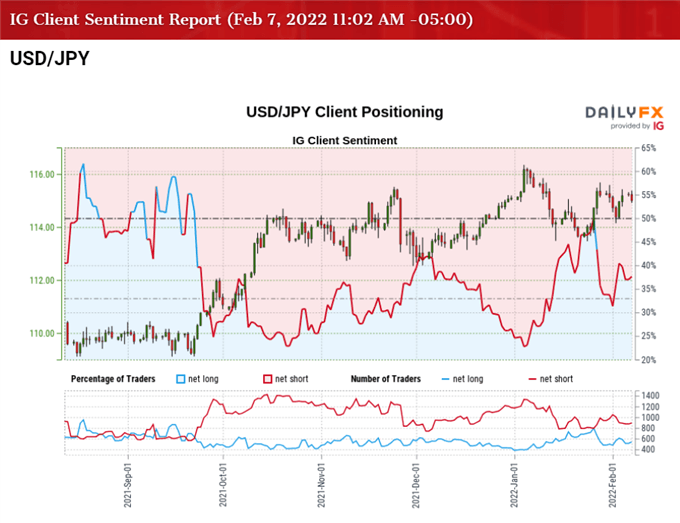
The IG Client Sentiment Report shows 36.85% of traders are currently net-long USD/JPY, with the ratio of traders short to long standing at 1.71 to 1.
The number of traders net-long is 8.38% higher than yesterday and 10.98% higher from last week, while the number of traders net-short is 9.04% higher than yesterday and 9.24% lower from last week. The rise in net-long interest has helped to alleviate the tilt in retail sentiment as only 31.39% of traders were net-long USD/JPY last week, while the decline in net-short position could be a function of profit-taking behavior as the exchange rate gives back the advance following the US NFP report.
With that said, USD/JPY may continue to track the January range as it struggles to extend the series of higher highs and lows from last week, but another uptick in the US CPI may help to invalidate a possible head-and-shoulders formation as market participants brace for an imminent shift in Fed policy.
USD/JPY RATE DAILY CHART

Source: Trading View
- The broader outlook for USD/JPY remains constructive as the 200-Day SMA (111.80) retains the positive slope from last year, but a head-and-shoulders formation appears to be taking shape following the failed attempt to test the January high (116.35).
- However, USD/JPY may threaten the January range as it struggles to extend the series of higher highs and lows from last week, with a move below the Fibonacci overlap around 113.80 (23.6% expansion) to 114.30 (23.6% retracement) raising the scope for a test of last month’s low (113.47).
- Failure to defend the January range opens up the 112.40 (61.8% retracement) to 112.80 (38.2% expansion) region, which lines up with the November low (112.53), with a move below the 200-Day SMA (111.80) bringing the 111.10 (61.8% expansion) to 111.70 (50% expansion) area on the radar.
- Need a move above the 115.90 (100% expansion) to 116.10 (78.6% expansion) region to bring the January high (116.35) back on the radar, with the next area of interest coming in around 117.60 (23.6% retracement) to 117.90 (23.6% retracement).
Disclosure: See the full disclosure for DailyFX here.


