USD/JPY Plummeted Towards 142.00 Following US NFPs

Image Source: Pixabay
- The USD/JPY currency pair fell to the lowest point seen since June 23, recording more than 1% losses on the day.
- The NFP report showed that the US added 209,000 jobs in June vs. the 225,000 expected.
On Friday, the USD/JPY currency pair plunged towards the 142.15 area, a two-week low, and appeared set to record a weekly gain after three consecutive weeks of losses. However, the US dollar faced severe selling pressure after Nonfarm Payrolls came in lower than expected. However, wage inflation still remains sticky.
The recent release by the US Bureau of Labor Statistics indicated that the Nonfarm Payrolls for June fell below expectations. The report revealed that the US economy added 209,000 jobs in June, which was lower than the anticipated 225,000 reading and lower than the previous figure of 306,000. Additionally, wage growth remained positive, with a monthly increase of 0.4%, surpassing the expected 0.3%. The Unemployment rate stood at 3.6%.
As a result of these figures, there was a widespread decline in US Treasury yields. The 2-year yield experienced a significant drop of over 1.70%, settling at 4.90%. Similarly, the 5-year and 10-year yield rates reached 4.29% and 4.02%, respectively.
It’s worth noticing that Jerome Powell has mentioned the possibility of further tightening due to a tight labor market and warned it could see some “pain.” In addition, while wage inflation remains sticky, the Fed will be pressured to continue tightening or keep rates high until progress to the downside is seen.
Meanwhile, based on the CME FedWatch Tool, investors are fully factoring in a 25 basis points increase in the upcoming July meeting of the Fed. If this occurs, it will raise the rates within the range of 5.25% to 5.50%, and an additional 25 bps hike by December is nearly 40% priced in.
All eyes are now on the forthcoming release of the Consumer Price Index (CPI) data for June from the US, which is to be reported next Wednesday, as it will continue to shape expectations regarding the upcoming decision by the Federal Reserve on July 26.
USD/JPY Levels to Watch
According to the daily chart, bulls took a big hit and the outlook began to favor the Japanese yen. The Relative Strength Index (RSI) plunged towards 50.00 As well, the Moving Average Convergence Divergence (MACD) printed a red bar, indicating that the bears have begun to take the lead. In addition, the bulls failed to defend the 20-day Simple Moving Average (SMA), a key support for the pair.
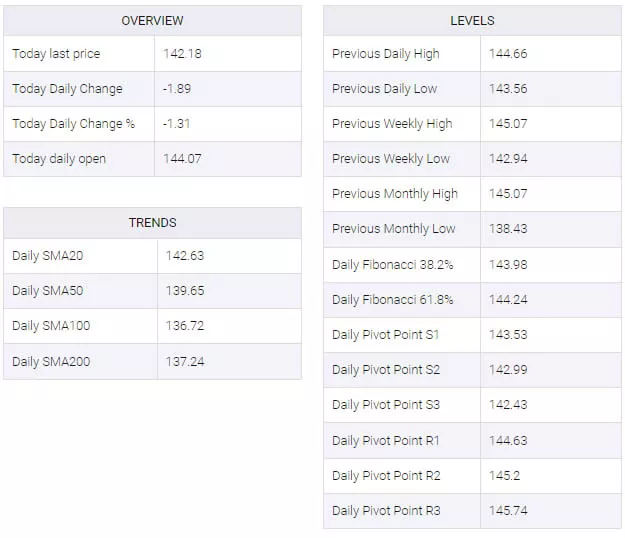
In case of further downside, support levels can be seen at 142.00, followed by the 141.40 area and the 140.35 zone. On the upside, the 20-day SMA may serve as the nearest resistance at 142.75, followed by the 143.00 area and the 143.60 level.
USD/JPY Daily Chart
-638243478257549391.png)
USD/JPY Technical Levels

More By This Author:
USD/JPY Dives To Nearly Two-Week Low Amid Risk-Off, Eyes 143.00 Ahead Of US NFPSilver Price Analysis: XAG/USD Dips Below $23.00 And The 200-Day EMA As US Yields Surge
US JOLTS Preview: Job Openings Below 10 Million Could Prevent An Extra Fed Rate Hike
Disclaimer: Information on these pages contains forward-looking statements that involve risks and uncertainties. Markets and instruments profiled on this page are for informational purposes only ...
more


