USD/JPY Gains Some Ground On BoJ Intervention Prospects
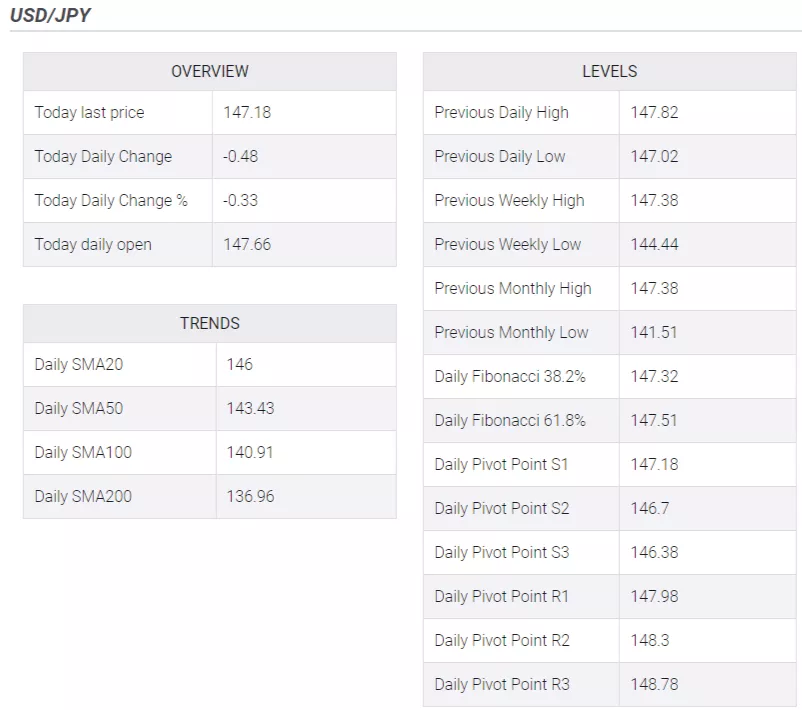
In Thursday’s session, the USD/JPY slightly fell towards the 147.20 area, driven by the growing expectations of the Bank of Japan (BoJ) taking action to stop the JPY’s decline. On the other hand, the USD is consolidating, but hawkish bets on the Federal Reserve (Fed) limit the downside for the Greenback.
The US Bureau of Labour Statistics reported that the number of people filing for unemployment benefits increased but was lower than expected. The actual figure came in at 216,000 vs. the 234,000 expected and was lower than the previous weekly reading of 229,000.
Meanwhile, the USD measured by the DXY index holds above the 105.00 zone, its highest level since March. On the other hand, US Treasury yields slightly retreated but remained in weekly highs after yesterday’s rally following the strong ISM PMI figures from the US from August. In that sense, the CME FedWatch tool suggests that markets still bet on higher odds of one last hike by the Federal Reserve (Fed) in this cycle, and the odds of a 25 basis point in November and December stan near 40%.
However, those expectations may change after next week’s Consumer Price Index (CPI) figures from the US from August.
On the Bank of Japan's (BoJ) front, Reuter reported that Japan's top currency diplomat, Masato Kanda, stated that the Japanese banking authorities are considering an intervention to end “speculative” movements. In that sense, in case the BoJ steps in, the JPY may see some upside, but monetary policy divergences seem to be the main reason for Yen’s weakness. Furthermore, on Friday, investors will see Japan's Gross Domestic Product (GDP) Q2 revision figures.
USD/JPY Levels to watch
Observing the daily chart, the USD/JPY displays signs of bullish exhaustion, leading to a neutral to bearish technical perspective. The Relative Strength Index (RSI) displays a negative slope in the bullish territory, hinting at a potential shift in momentum, while the Moving Average Convergence (MACD) exhibits shorter green bars. In the broader context, the pair is above the 20,100,200-day Simple Moving Average (SMA), highlighting the continued dominance of bulls on the broader scale.
Support levels: 147.00, 146.50, 146.10 (20-day SMA).
Resistance levels:147.50, 148.00, 148.50.
USD/JPY Daily Chart
(Click on image to enlarge)
-638296986911906841.png)

More By This Author:
US Dollar On Winning Streak, While Shift In Monetary Policy Unfolds
GBP/USD Slumps Sharply As BoE Signals Peak Interest Rates, US Business Activity Improves
AUD/USD Trades Neutral At 0.6380 After The US Fed Beige Book Release
Disclaimer: Information on these pages contains forward-looking statements that involve risks and uncertainties. Markets and instruments profiled on this page are for informational purposes only ...
more


