USD/JPY Falls Back Towards 150.50, Pares Away Mid-Week Gains

Yen. Image Source: Pixabay
The USD/JPY slipped to a Thursday low of 150.30 after a batch of bad US data soured risk appetite. The pair slipped from the 151.40 region as the USD/JPY whipsaws through the trading week.
US Initial Jobless Claims for the week into November 10th missed the mark, showing nearly a two-year high of 231 thousand new unemployment benefit seekers versus the expected 220 thousand. The previous week showed 218 thousand new jobless claimants, and investors have rotated their perspective to now be concerned about the state of the US economy.
US Industrial Production for October also declined past expectations, printing at -0.6% compared to the forecast -0.1%. US capacity fell from September's 0.1% soft reading, which was revised downwards from 0.3%.
The trading week will round out with Friday's US Building Permit and Housing Starts figures, where investors will be looking to take a pulse reading of the US economy.
USD/JPY Technical Outlook
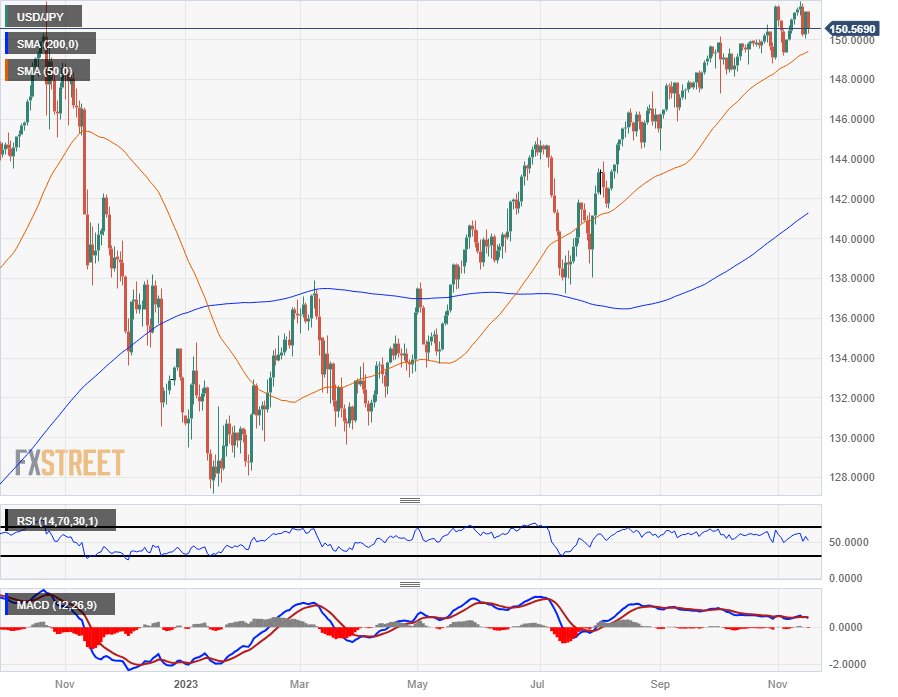
The USD/JPY is churning near the extreme top-end of long-term trading, cycling the 151.00 level. The pair remains extremely well-bid, and the pair looks set for another fresh run at multi-decade highs above 152.00.
Medium-term support is coming from the 50-day Simple Moving Average (SMA) rising into 149.50, and the USD/JPY's long-term bull run has seen price action pull well away from the long-run 200-day SMA near 141.25.
USD/JPY Daily Chart
(Click on image to enlarge)

USD/JPY Technical Levels
USD/JPY
| OVERVIEW | |
|---|---|
| Today last price | 150.6 |
| Today Daily Change | -0.82 |
| Today Daily Change % | -0.54 |
| Today daily open | 151.42 |
| TRENDS | |
|---|---|
| Daily SMA20 | 150.44 |
| Daily SMA50 | 149.34 |
| Daily SMA100 | 146.39 |
| Daily SMA200 | 141.2 |
| LEVELS | |
|---|---|
| Previous Daily High | 151.42 |
| Previous Daily Low | 150.05 |
| Previous Weekly High | 151.6 |
| Previous Weekly Low | 149.35 |
| Previous Monthly High | 151.72 |
| Previous Monthly Low | 147.32 |
| Daily Fibonacci 38.2% | 150.89 |
| Daily Fibonacci 61.8% | 150.57 |
| Daily Pivot Point S1 | 150.5 |
| Daily Pivot Point S2 | 149.59 |
| Daily Pivot Point S3 | 149.14 |
| Daily Pivot Point R1 | 151.87 |
| Daily Pivot Point R2 | 152.33 |
| Daily Pivot Point R3 | 153.24 |
More By This Author:
Oil Sinks Over 1% As PPI Confirms Slowdown In CPIUSD/CAD Price Analysis: Struggles To Capitalize On Its Modest Intraday Gains Beyond 1.3700
EUR/GBP Price Analysis: The Upside Barrier Is Seen At The 0.8750-55 Zone
Disclosure: Information on this article contains forward-looking statements that involve risks and uncertainties. Markets and instruments profiled on this page are for informational purposes ...
more


