

Yen. Image Source: Pixabay
The USD/JPY pair, currently trading at 152.95 with a modest loss of 0.17%. Despite a drop in consumer confidence in the US, indicated by the University of Michigan's (UoM) Consumer Sentiment Index the Greenback will close a winning week, on the back of hot inflation data reported on Wednesday and Thursday.
Consumer confidence in the US weakened in early April, with the UoM's Consumer Sentiment Index edging lower to 77.9 from 79.4 in March. This reading came in below the market expectation of 79. The Current Conditions Index declined to 79.3 from 82.5 and the Consumer Expectations Index fell to 77 from 77.4. The details of the survey also revealed that the one-year inflation outlook climbed to 3.1% from 2.9% in April, while the five-year inflation outlook rose to 3% from 2.8%.
That being said, the US Bureau of Labor Statistics revealed a rise in inflation this week, with the Consumer Price Index (CPI), rising to 3.5% year-over-year in March, up from February's 3.2%. The core CPI, also increased to 3.8% Yoy, matching February's level. In that sense, hot inflation figures fueled a sharp rise in hawkish bets on the Federal Reserve (Fed) and in the US Treasury yields which benefited the USD during the week. As for now, markets seem to have given up on the hopes of a June rate cut and if data validated those bets, the USD may see further upside. Next Monday, the US will release Retail Sales figures from March.
USD/JPY technical analysis
On the daily chart, the USD/JPY pair reveals a sustained trend in positive territory on the Relative Strength Index (RSI). Even with the slight decrease observed back below 70, the dominant trend is bullish and buyers just seem to be correcting overbought conditions. Simultaneously, a reading of green bars on the Moving Average Convergence Divergence (MACD) histogram consolidates the buying momentum thesis.
USD/JPY daily chart
(Click on image to enlarge)
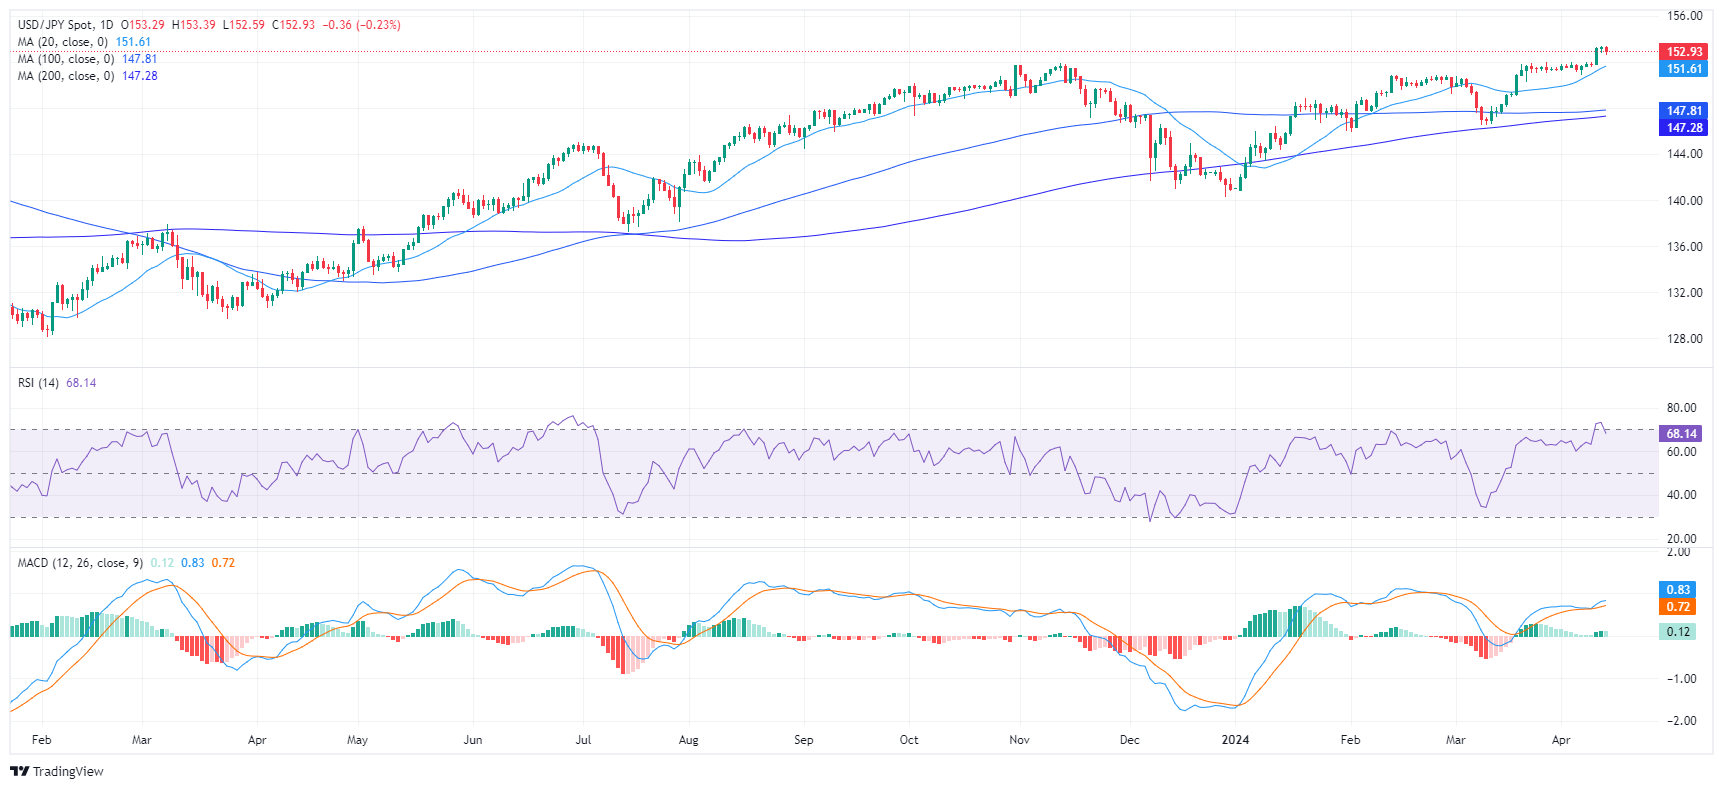
On examining the broader outlook, the USD/JPY reveals a bullish posture. The pair's position above the 20-day, 100-day, and 200-day Simple Moving Average (SMA) portrays a positive short-term and long-term trend.
USD/JPY
| OVERVIEW | |
|---|---|
| Today last price | 153.04 |
| Today Daily Change | -0.24 |
| Today Daily Change % | -0.16 |
| Today daily open | 153.28 |
| TRENDS | |
|---|---|
| Daily SMA20 | 151.42 |
| Daily SMA50 | 150.19 |
| Daily SMA100 | 147.78 |
| Daily SMA200 | 147.23 |
| LEVELS | |
|---|---|
| Previous Daily High | 153.32 |
| Previous Daily Low | 152.76 |
| Previous Weekly High | 151.95 |
| Previous Weekly Low | 150.81 |
| Previous Monthly High | 151.97 |
| Previous Monthly Low | 146.48 |
| Daily Fibonacci 38.2% | 153.11 |
| Daily Fibonacci 61.8% | 152.97 |
| Daily Pivot Point S1 | 152.92 |
| Daily Pivot Point S2 | 152.56 |
| Daily Pivot Point S3 | 152.36 |
| Daily Pivot Point R1 | 153.48 |
| Daily Pivot Point R2 | 153.68 |
| Daily Pivot Point R3 | 154.04 |
More By This Author:
NZD/USD Refreshes Daily Low On Weaker Chinese Trade Data, Sustained USD Buying
AUD/USD Price Analysis: Bears Await Sustained Break And Acceptance Below 0.6500 Mark
AUD/USD Slides To 0.6525 Area, Fresh Daily Low As Traders Await Chinese Trade Data


Comments
Log in or sign up to join the conversation.