
USD/JPY Analysis: Can Markets Witness A Huge Correction?
The USD/JPY analysis shows a rebound as the US Dollar Index has turned to the upside. However, the pair is into a corrective phase after registering amazing growth. A larger downside movement could be signaled by DXY’s deeper decline.
Also, the Nikkei (JP225) is bearish in the short term, signaling that the Yen could still appreciate versus its rivals. The USD/JPY pair has rebounded, but it could still come back down to challenge the support zone before deciding direction.
The US data could change the sentiment again. Some poor economic figures could send the pair down. On the other hand, the Unemployment Claims could drop from 373K to 350K last week, which could be good for the USD. Actually, maybe the Greenback rallies ahead of the US economic figures. The Industrial Production and the Capacity Utilization Rate indicator will be released as well.
-Are you looking for automated trading? Check our detailed guide-
Also, you should be careful around the FED Chair Powell Testifies; anything could happen around this high-impact event.
DXY is still bullish!
(Click on image to enlarge)
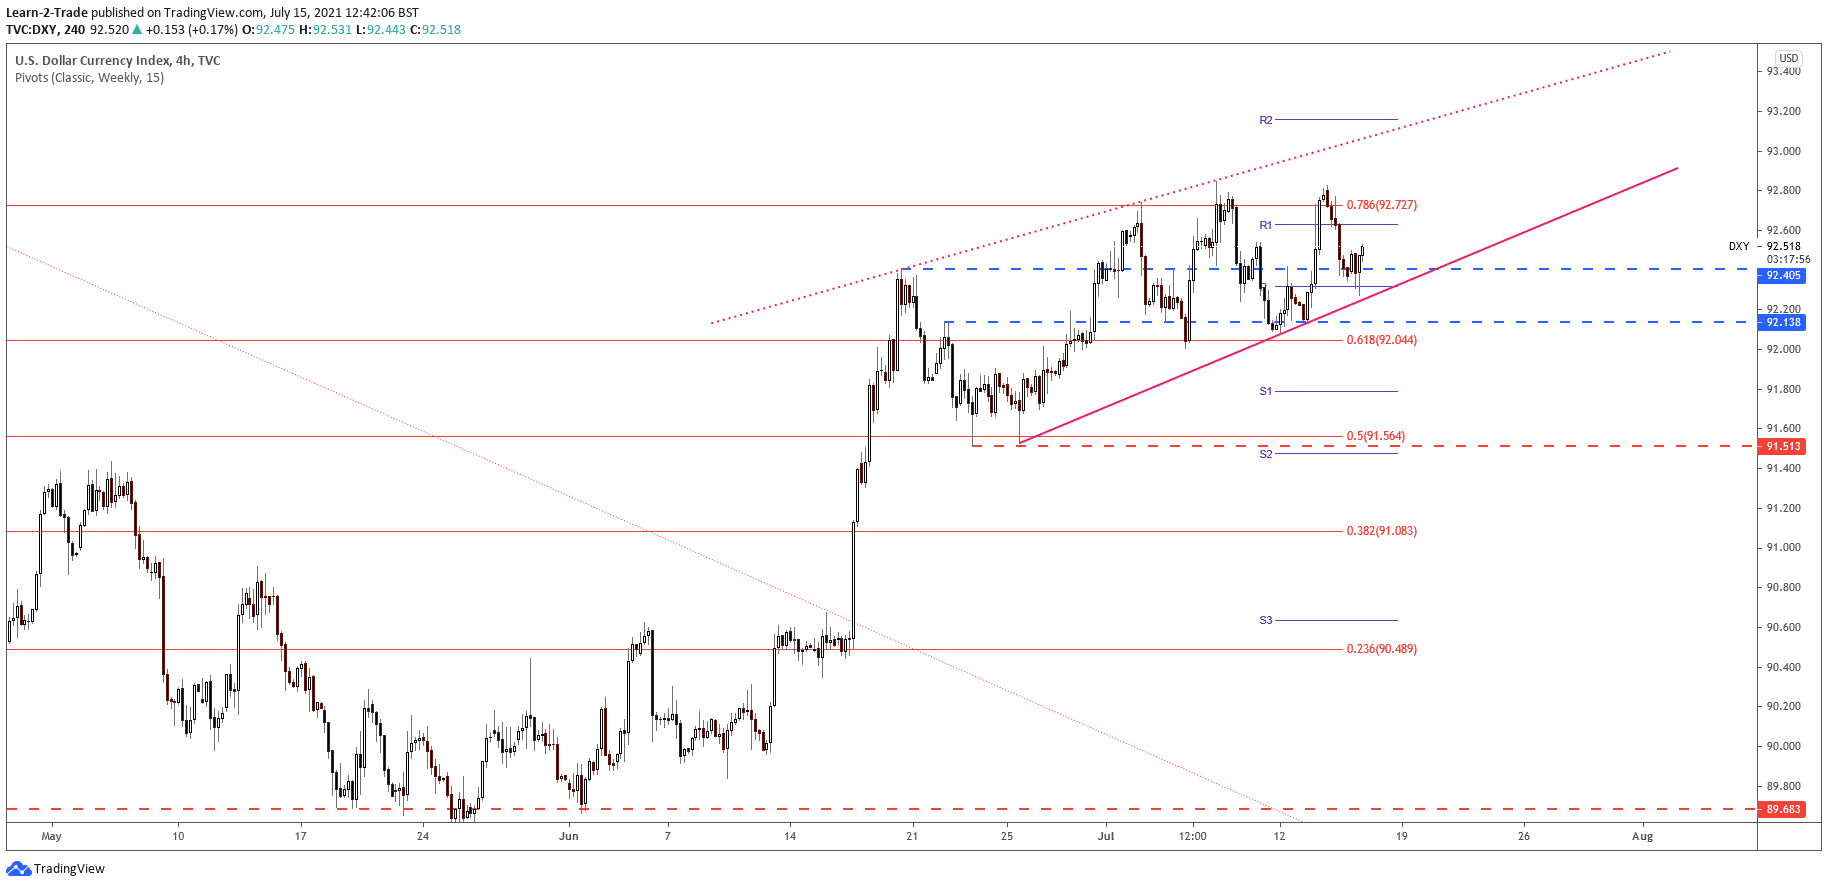
US Dollar analysis on 4-hour chart
The Dollar Index increased after failing to stay under the weekly pivot point (92.319). However, it is still located far above the uptrend line, so it could still increase in the short term. It remains to see how it will react around the R1 (92.63) level.
The major resistance is seen around the 78.6% (92.72) level. Technically, the pair has shown some overbought signals developing a Rising Wedge and showing a bearish divergence. Still, a larger downside movement is far from being confirmed.
USD/JPY technical analysis: More losses to come?
(Click on image to enlarge)
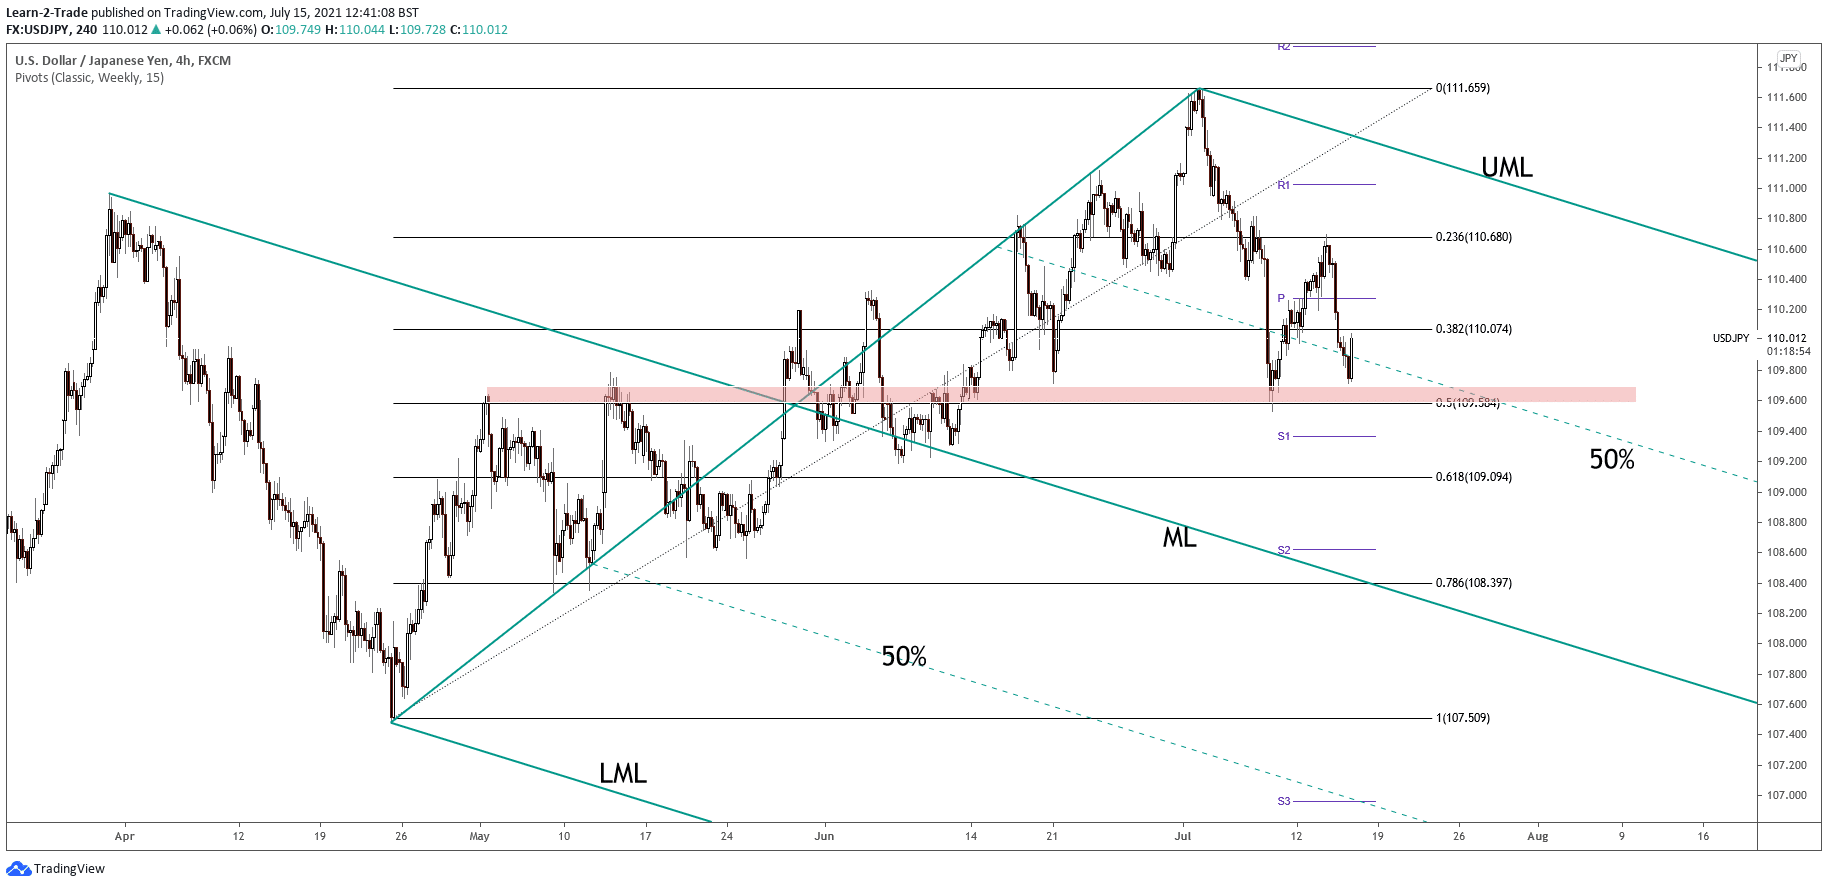
USD/JPY analysis on 4-hour chart
USD/JPY has rebounded and now is retesting the 38.2% retracement level. However, the pressure remains high as long as it stays under this level. Also, it has failed to stabilize above the weekly pivot point (110.27) signaling a potential drop towards the S1.
Coming back under the upside 50% line of the descending pitchfork and making a new lower low could really signal a larger correction. So, dropping and stabilizing under the 50% retracement level may validate a potential decline towards the 61.8% retracement level.
Disclaimer: Foreign exchange (Forex) trading carries a high level of risk and may not be suitable for all investors. The risk grows as the leverage is higher. Investment objectives, risk ...
more
Comments
 No Thumbs up yet!

