
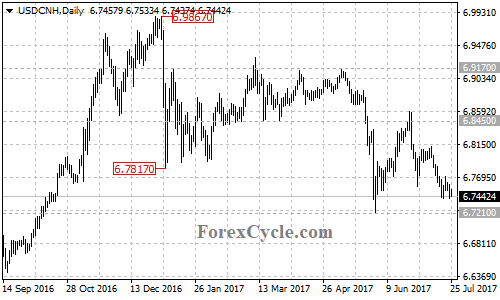
USD/CNH Is Facing 6.7210 Support
The USD/CNH pair failed to settle above 6.8450 resistance and pulled back to 6.7400 area, facing the previous low support at 6.7210. As mentioned before, the pullback would possibly be correction of the uptrend from 6.7210.
(Click on image to enlarge)
On the downside
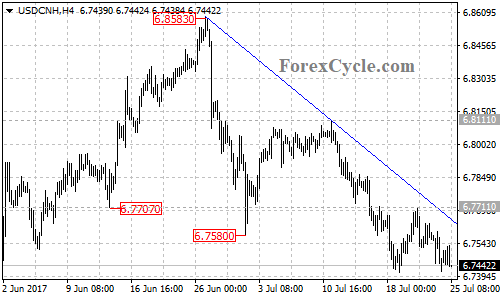
The pair stays below a descending trend line on its 4-hour chart, with resistance at around 6.7660. As long as the trend line resistance holds, the downside movement could be expected to continue and deeper decline to test 6.7210 support is possible.
(Click on image to enlarge)
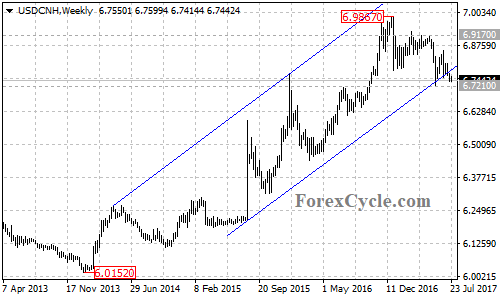
A breakdown below 6.7210 support will indicate that lengthier consolidation for the long term uptrend from the January 2014 low of 6.0152 is underway, then the pair will find next support level at around 6.6150, the 38.2% Fibonacci retracement took from 6.0152 to 6.9867.
(Click on image to enlarge)
On the upside
There is another near term resistance at 6.7711, a break of this level will indicate that the short term downtrend from 6.8111 is complete, then further rise to test 6.8111 resistance could be seen, above this level will confirm that the whole correction pullback from 6.8583 is complete, then the following upside movement could bring price to retest 6.8450 resistance.
Technical levels
Support levels: 6.7210 (the June 1 low), 6.6150 (the 38.2% Fibonacci retracement).
Resistance levels: 6.7660 (the descending trend line on the 4-hour chart), 6.7711 (near term resistance), 6.8111 (key resistance), 6.8450 (the March 15 low), 6.8583 (The June 26 high), 6.9170 (key resistance), 6.9867 (the January 3 high), 7.0000 (the important psychological level).


