

The USD/CHF price rallies as the Dollar Index edges higher. As you already know, we have a strong positive correlation between the DXY and the USD/CHF pair.
The currency pair rises when the index rises, and it drops when the dollar index falls. It remains to see what will happen as the DXY is almost reaching a dynamic resistance represented by a downtrend line.
Fundamentally, the Swiss Franc lost ground even though the Switzerland Unemployment Rate has dropped from 3.0% to 2.9% as expected. The foreign currency reserves were reported at 929B above 922B in the last reporting period.
The USD/CHF pair is trapped within two chart patterns, so escaping from these formations could bring trading opportunities. However, it’s premature to go long or short on this pair if we don’t have confirmation from the Dollar Index.
Dollar Index price technical analysis: Downtrend channel
(Click on image to enlarge)
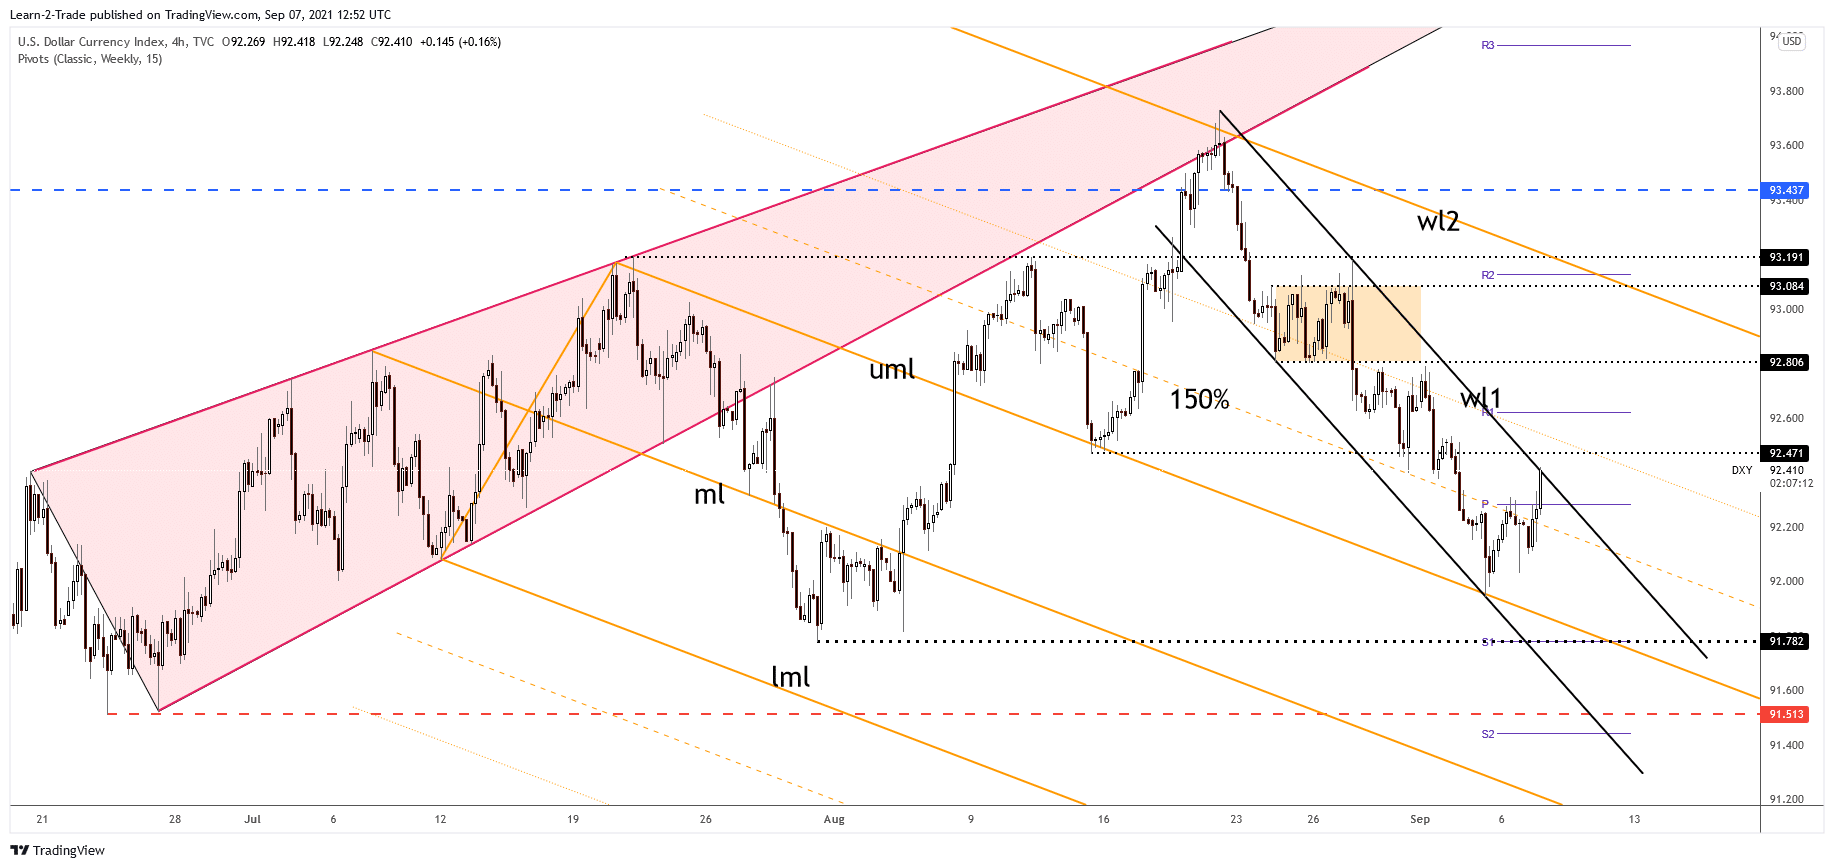
DXY 4-hour price chart
The Dollar Index has registered an impressive rally after reaching the descending pitchfork’s upper median line (UML). Now is pressuring the downtrend line, the down channel’s resistance. 92.47 is seen as a static upside obstacle. It remains to see how it will react around the current obstacles. Technically, a false breakout could signal that the rebound is over and that the index would back down.
USD/CHF price technical analysis: Triangle pattern to play
(Click on image to enlarge)
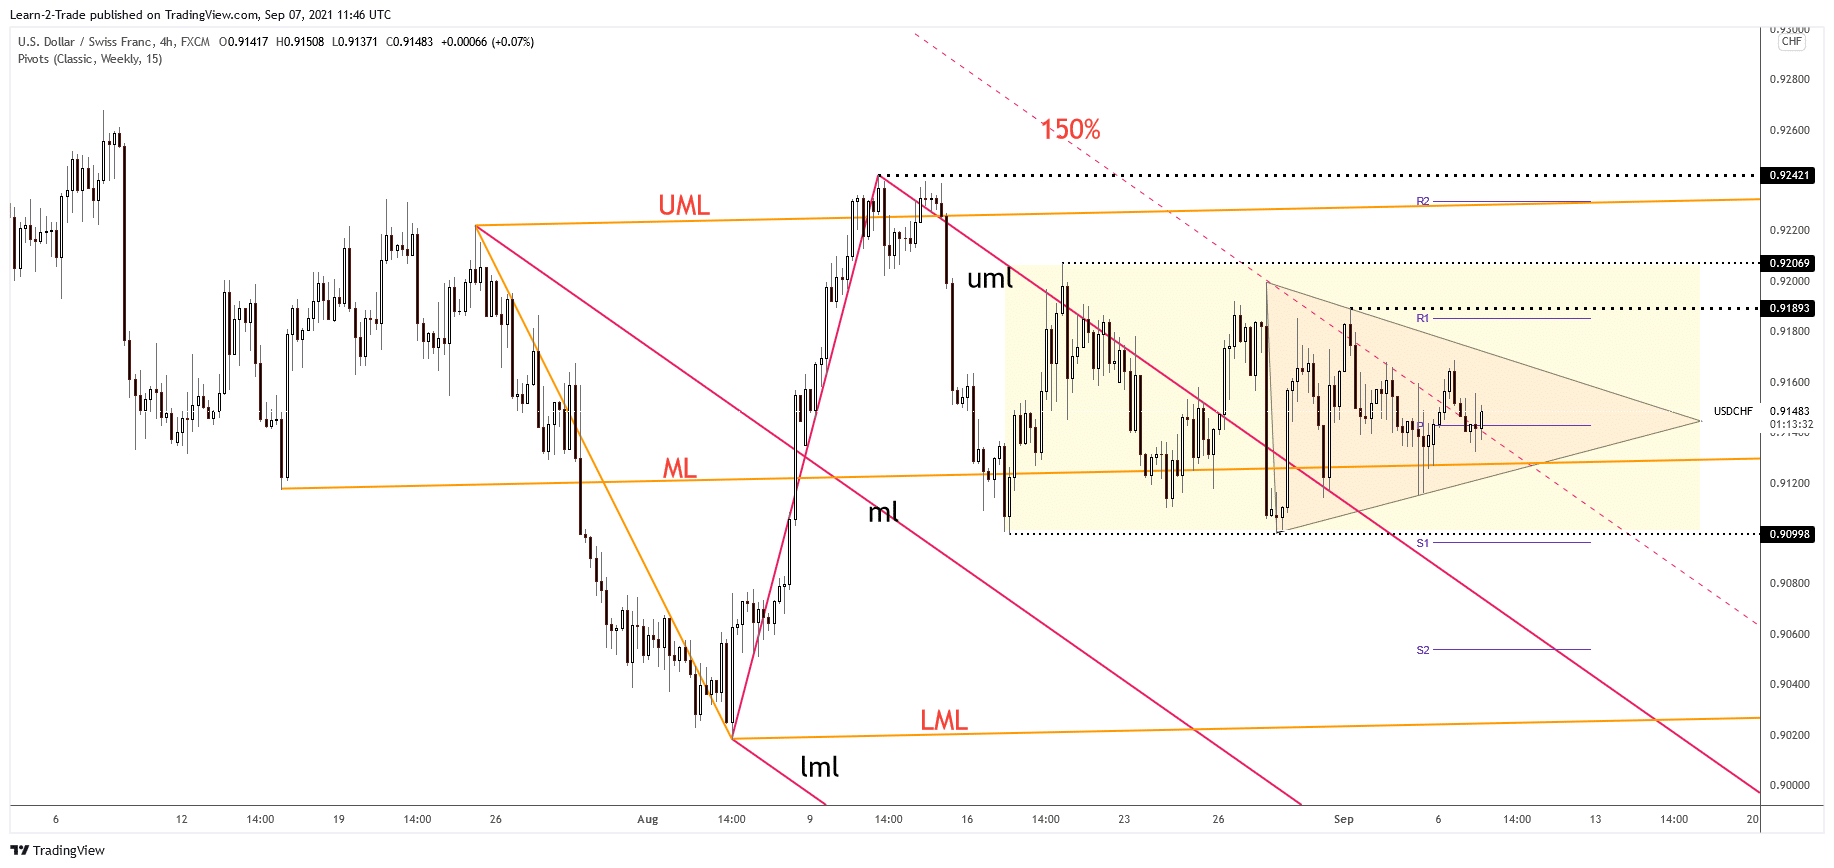
USD/CHF 4-hour price chart analysis
The USD/CHF pair failed to stabilize under the weekly pivot point (0.9142) and under the 150% Fibonacci line in the last attempt. It has registered a false breakdown through the confluence area formed at the intersection of the mentioned levels.
The price is almost to reach the symmetrical triangle’s resistance which is seen as an upside obstacle. An upside breakout from this pattern could signal further growth at least until the 0.9189 former high. On the other hand, I believe that a false upside breakout could signal a bearish movement. A larger downside movement could be activated by a new lower low if the USD/CHF drops and stabilizes below 0.9099.
From the technical point of view, the price may form a broader upwards movement if it makes a valid breakout through the 0.9189 static resistance.

Comments
Log in or sign up to join the conversation.